2024 Letter to Stockholders
FROM OUR PRESIDENT, CEO & CIO, PETER FEDERICO
DEAR FELLOW STOCKHOLDERS:
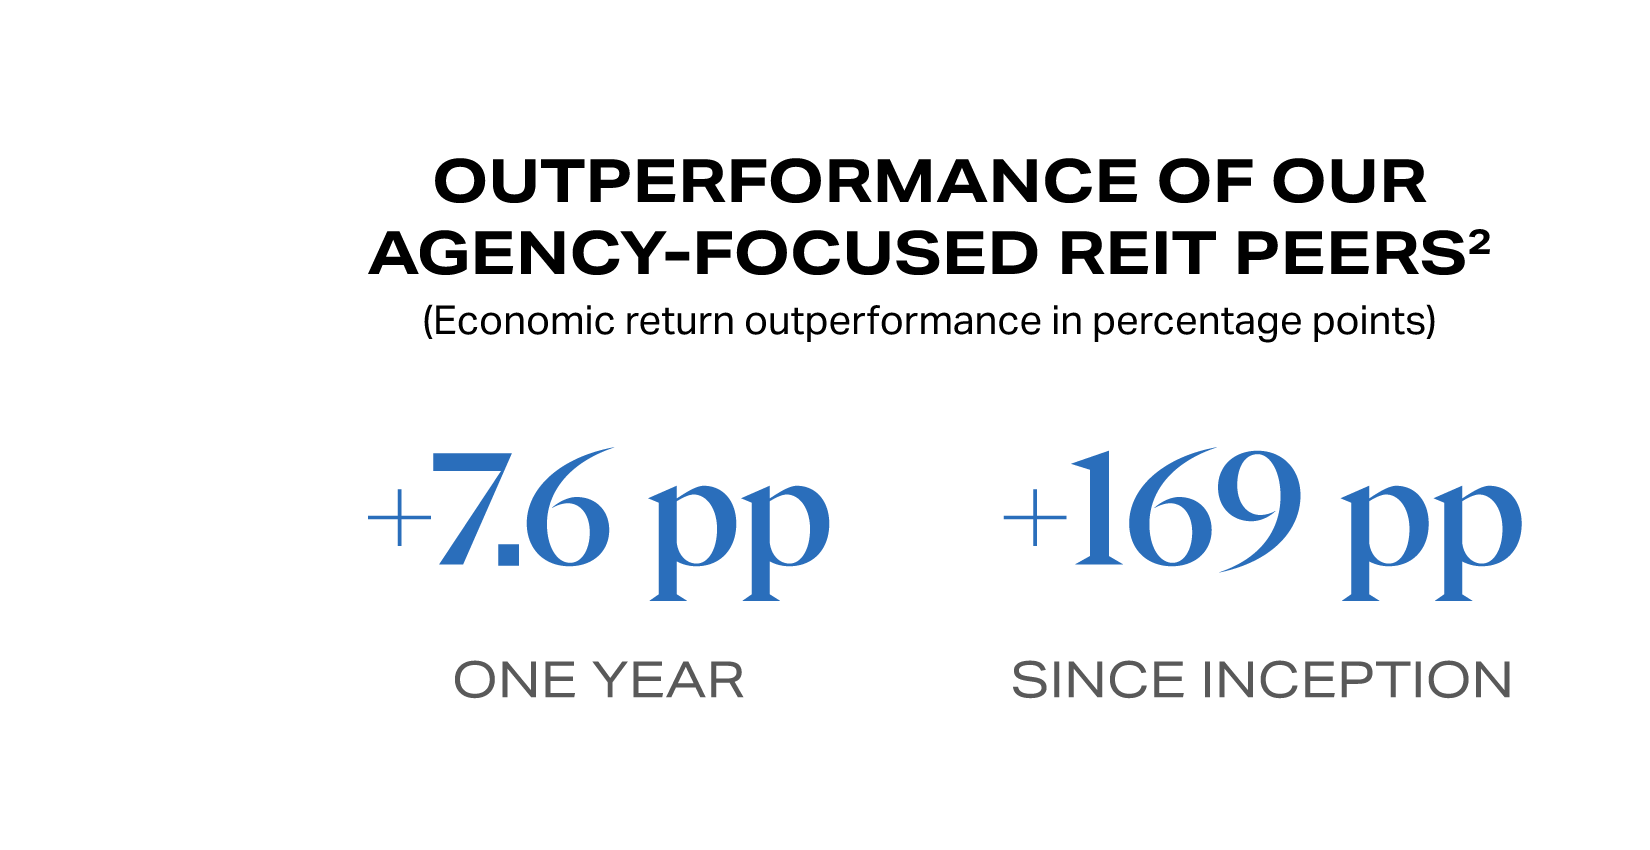
The favorable Agency MBS investment environment that we had anticipated definitively arrived in 2024. Following an unprecedented dual-track approach to monetary policy tightening that began in March 2022, the Federal Reserve (the “Fed”) finally took the initial steps in its pivot from a highly restrictive monetary policy stance to a more accommodative posture. Importantly, interest rate volatility eased, the yield curve steepened, and Agency MBS spreads to benchmark rates stabilized in a relatively narrow and advantageous trading range. Against this improved macroeconomic backdrop, AGNC delivered a 13.2% economic return for the year, powered by our compelling monthly dividend. AGNC’s economic return was the highest among our Agency REIT Peer Group and significantly above the peer average of 5.6%.1,2
Driven by an attractive
dividend yield component,
AGNC generated an economic
return of 13.2% in 2024, and,
notably, we have delivered an
annualized total stock return of
10.0% since inception in 2008.2,3
Our strong 2024 annual results illustrate our ability to generate compelling risk-adjusted returns during periods of moderate interest rate volatility and wide and stable Agency MBS spreads. Entering 2025, we maintain our very positive outlook for Agency MBS, a fundamental building block of a well-diversified portfolio. AGNC provides our stockholders access to this asset class through a platform that has generated best-in-class returns since our IPO, highlighting the benefits of our active portfolio management strategies, industry-leading operating efficiency, and accretive capital management approach.

THE OPPORTUNITY
Agency-guaranteed residential
MBS investments paired with
highly attractive funding

THE OBJECTIVE
Favorable long-term stockholder
returns with a substantial
dividend yield component

THE IMPACT
Permanent capital supporting
American homeownership
across generations
Monetary Policy: A Gradual Path to Neutral
Throughout 2022 and 2023, the Fed raised the federal funds rate by 525 basis points while simultaneously reducing its balance sheet by $1.3 trillion. As a result of this multi-year hiking cycle, the federal funds rate remained at its 22-year peak of 5.50%4 for over a year. This aggressive monetary policy campaign, along with a persistently turbulent macroeconomic climate, led to sharply higher interest rates, a dramatic widening of Agency MBS spreads, and prolonged volatility across both of these measures. These adverse dynamics ultimately reduced Agency MBS valuations significantly and created an extremely challenging environment for managing a levered Agency MBS portfolio.
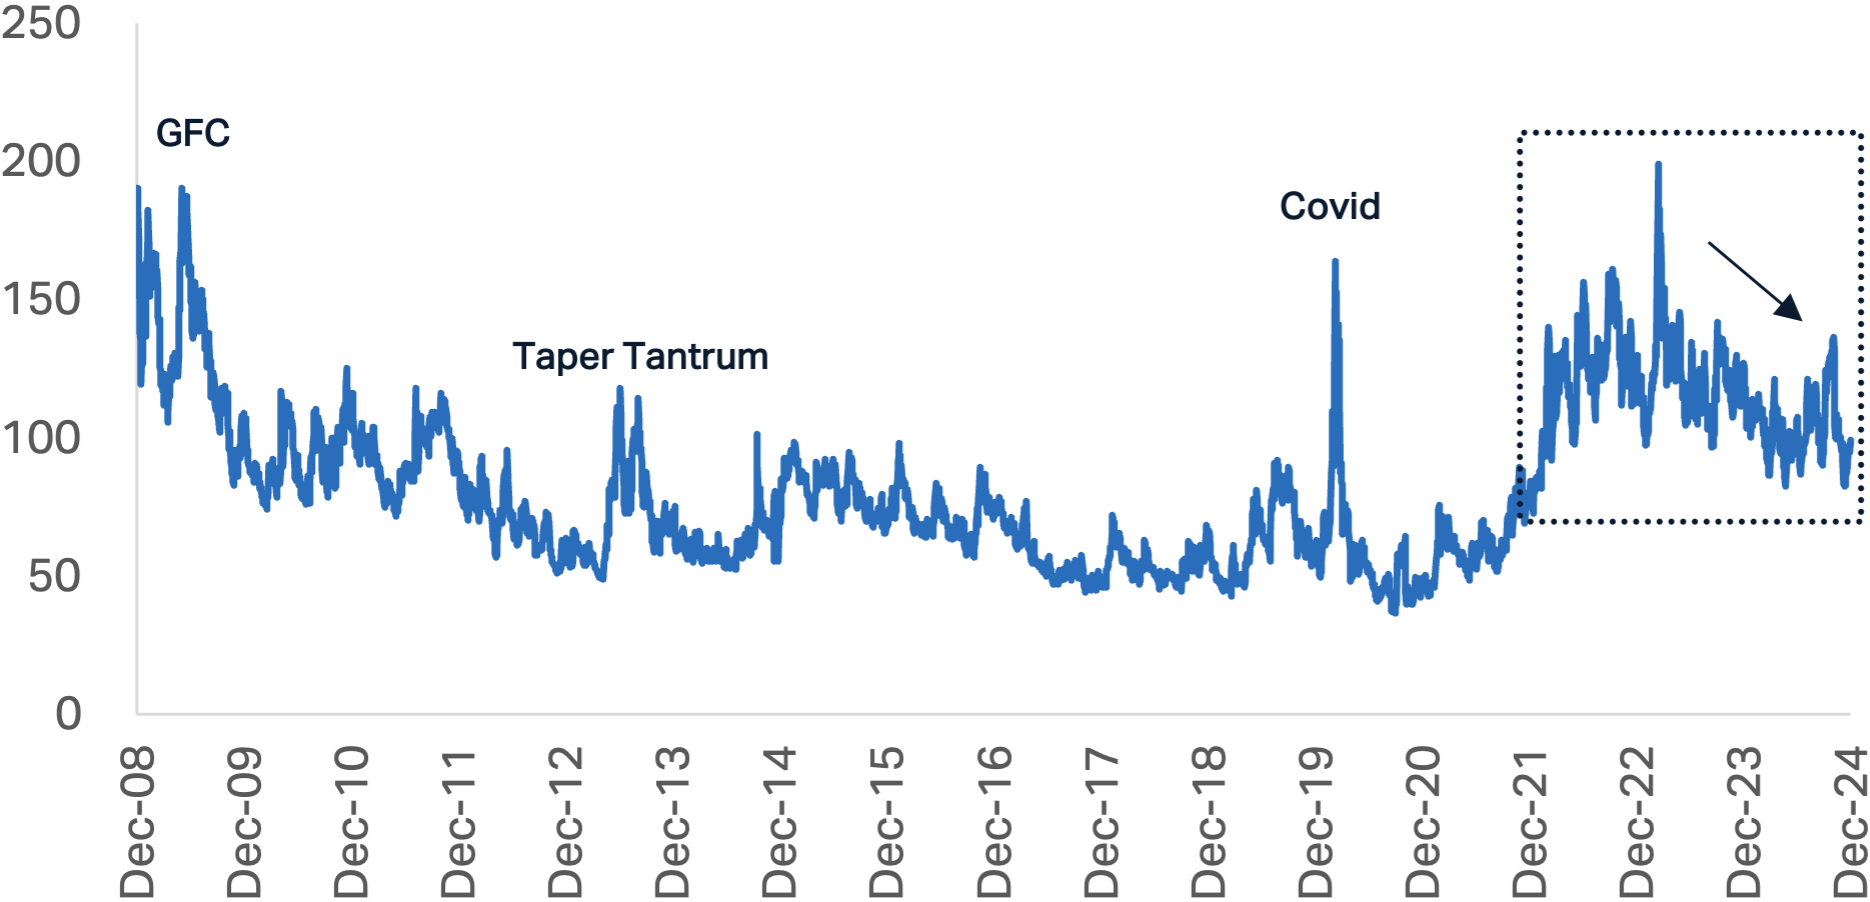
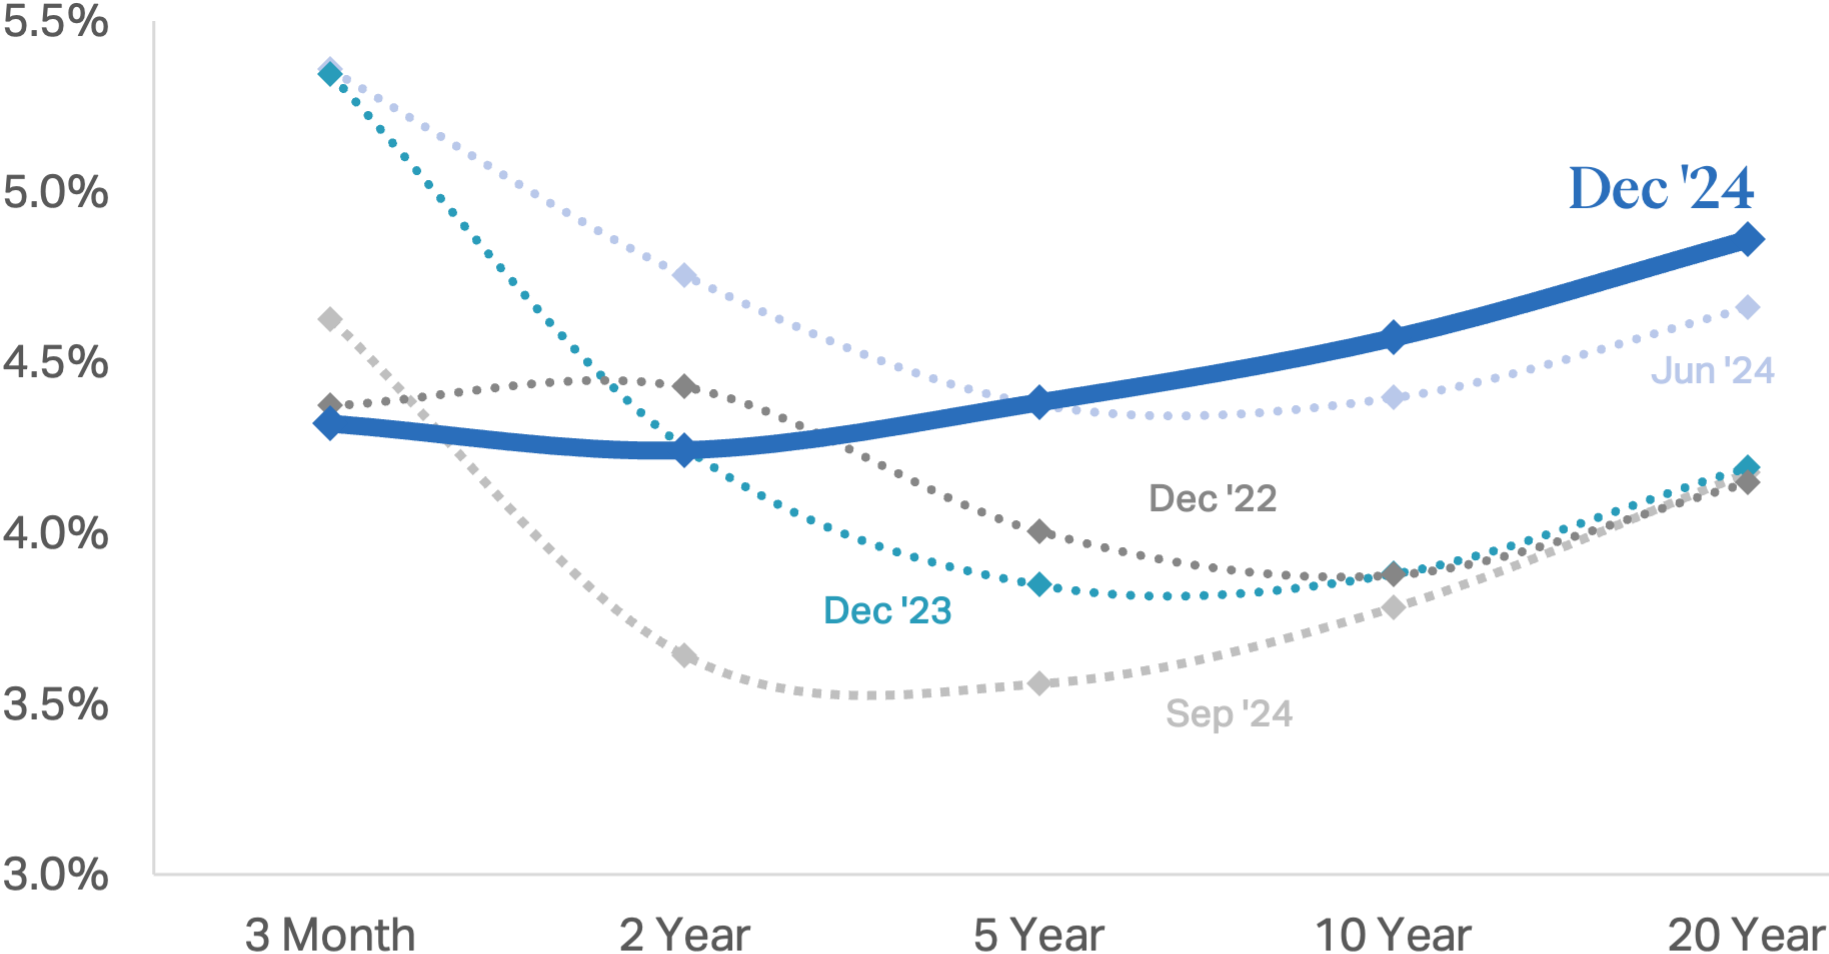
In September 2024, the Fed finally began to recalibrate monetary policy by delivering its first rate cut in over four years, ultimately reducing the federal funds rate by 100 basis points by the end of the year. With this shift to a more accommodative monetary policy stance, supported by declining inflationary pressures and a stabilizing labor market, interest rate volatility eased, and the yield curve steepened after being inverted for the second longest episode on record.
Interest Rate Volatility (MOVE Index)5
U.S. Treasury Yield Curve6
While bouts of financial market volatility are inevitable, a more accommodative monetary policy outlook provides a constructive backdrop for investing in fixed income securities, including Agency MBS.
Agency MBS: A Compelling Portfolio Building Block
AGNC’s book value and earnings power – and by extension, stock price – are driven by our portfolio of Agency MBS. As such, through an investment in AGNC common stock, a stockholder gains exposure to Agency MBS – on a levered and hedged basis – and the diversification advantages this asset class offers. These assets benefit from compelling fundamentals and favorable attributes that we believe make them an important building block of any investment portfolio.
BENEFITS OF INVESTING IN AGENCY MBS
DIFFERENTIATED ASSET
Fundamental fixed income asset class that supports the U.S. mortgage market with minimal correlation to equities
GOVERNMENT SUPPORT
Agency-backed guarantee from Fannie Mae, Freddie Mac, or Ginnie Mae substantially eliminates credit risk for investors
SUBSTANTIAL YIELD OPPORTUNITY
Compelling current income with an ability to employ leverage through highly attractive funding that enhances return potential
HIGHLY LIQUID MARKET
Massive fixed income asset class with substantial trading liquidity, second only to the U.S. Treasury market
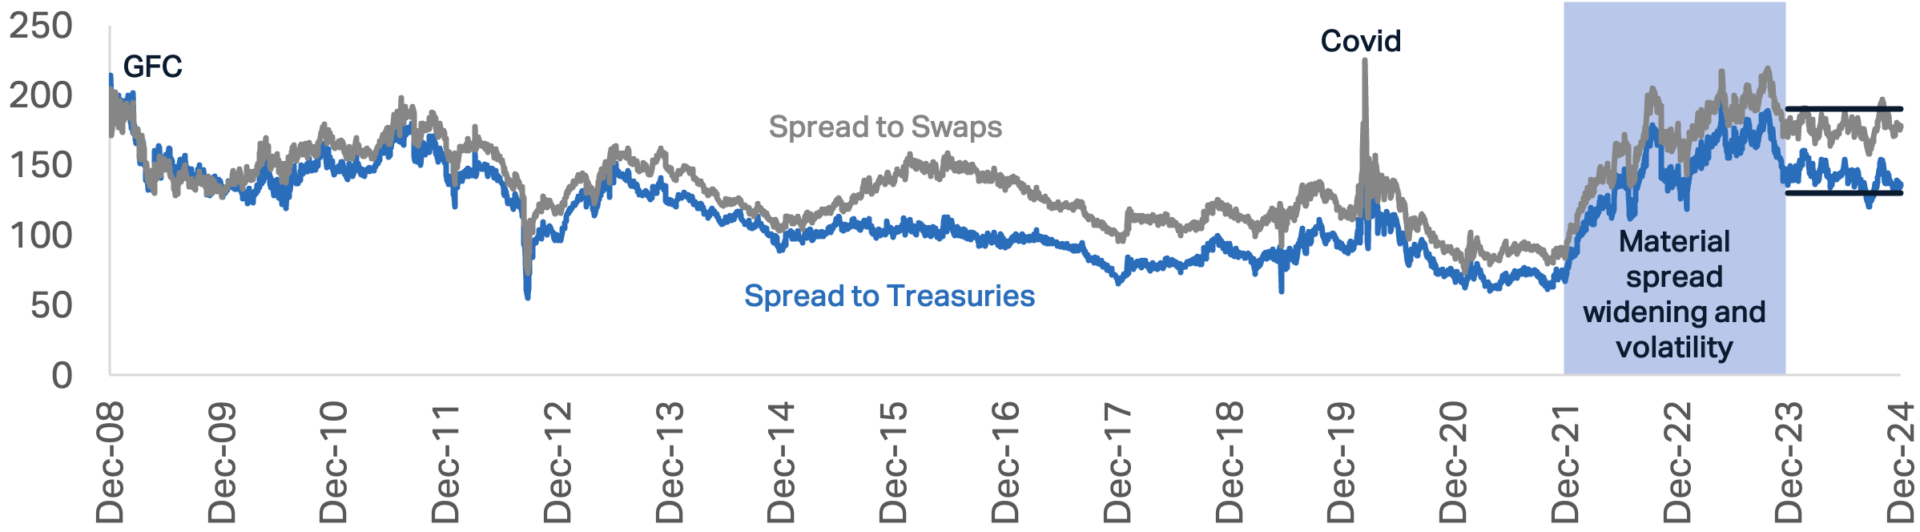
The current outlook for Agency MBS is enhanced by an attractive technical backdrop, as a confluence of factors has created a highly compelling entry point for new investments in this asset class. Most importantly, Agency MBS spreads to benchmark rates have generally stabilized in an advantageous trading range, and interest rate volatility has eased. Further, this newly established range is meaningfully wider than historical averages and disproportionately wide when compared to other fixed income asset classes. These technical factors present attractive projected returns for levered investors and enhance the relative value of Agency MBS investment opportunities within the broader fixed income universe.
Agency MBS Spreads7
(Basis Points)
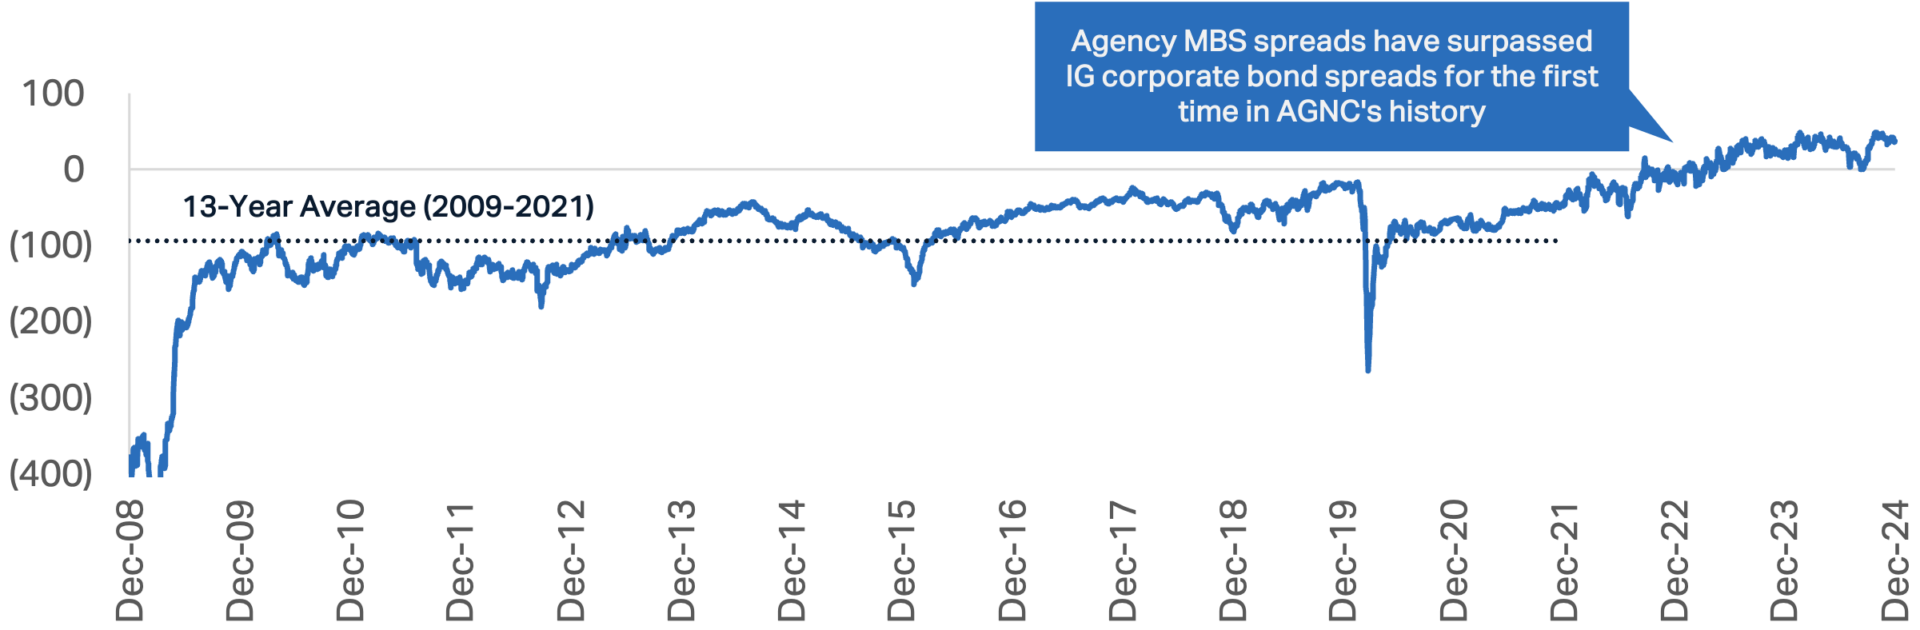
The relative value that Agency MBS currently offer is quite remarkable when considering that these assets have a risk profile similar to that of U.S. Treasuries, as they benefit from government support. Other fixed income products that offer yields in excess of U.S. Treasuries, such as investment grade and high yield corporate bonds and non-Agency securities, are not guaranteed against default and expose investors to credit risk. Notably, at current valuation levels, the yield on new production Agency MBS exceeds the yield on broad investment grade corporate bond indices. This inversion first occurred in late 2022 for the first time in AGNC’s history.
Differential Between Agency MBS Spreads and Investment Grade Corporate Bond Spreads8
(Basis Points)
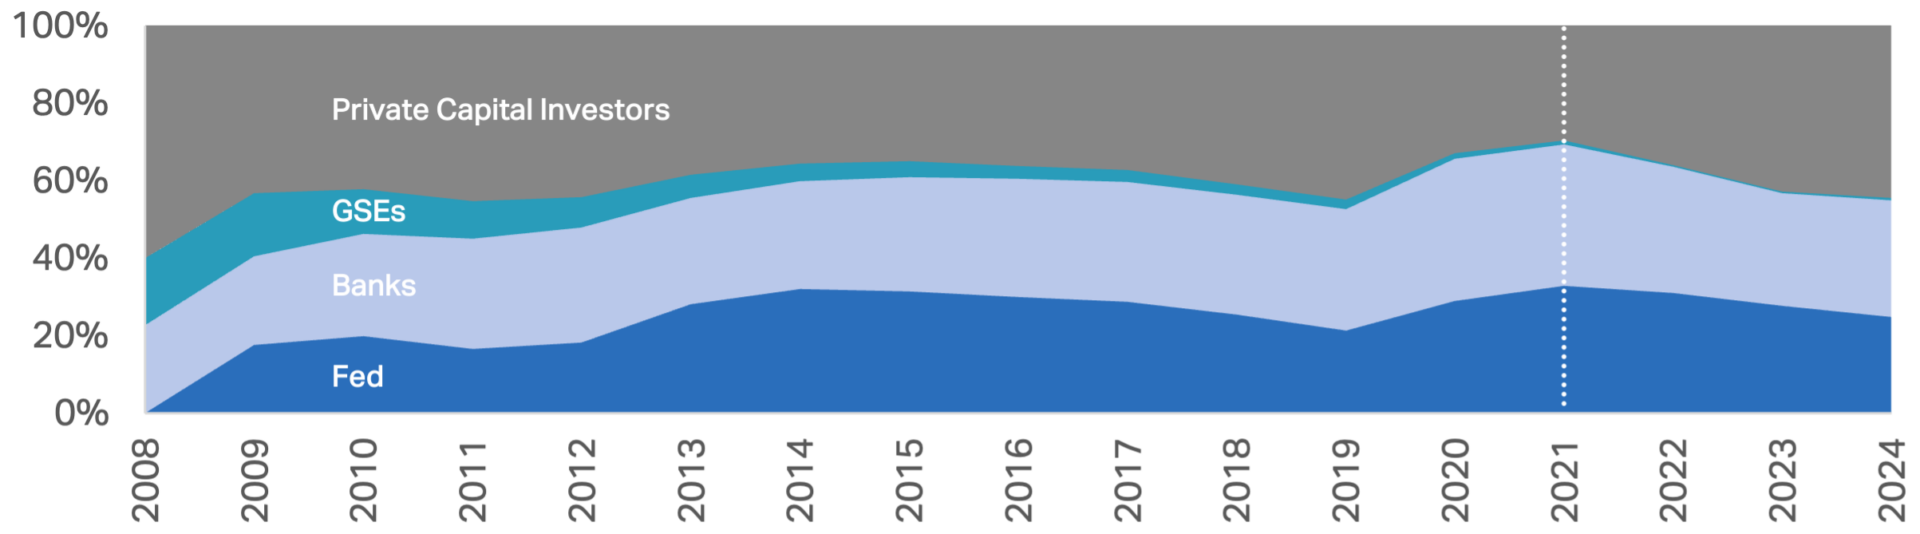
These attractive relative value attributes, coupled with the Fed’s ongoing reduction in its Agency MBS position, have led to a dramatic shift in Agency MBS market ownership to index-based money managers, a trend that continued throughout 2024. While this ownership transition has contributed somewhat to spread volatility, the increasing prevalence of index-based participants, whose investments are subject to technical money fund flows, provides further alpha generation opportunities for tactical Agency MBS specialists like AGNC.
Agency MBS Market Ownership Composition9
(% of Agency MBS Outstanding)
Lastly, longer-term interest rates have risen meaningfully with the expectation of an elongated Fed easing timeline. The 30-year primary mortgage rate at year-end was once again near 7%. At this rate level, we expect the supply of Agency MBS in 2025 to be similar to that of 2024 and reasonably well-aligned with investor demand, providing support for Agency MBS valuations. In addition, potential increases in bank demand, which fell sharply in 2022 and 2023, could once again provide incremental support for Agency MBS as regulatory constraints ease.
Together, these positive dynamics – coupled with the compelling fundamental benefits associated with Agency MBS – create a constructive investment backdrop for this high-quality asset.
AGNC: A Yield-Driven Agency MBS Leader
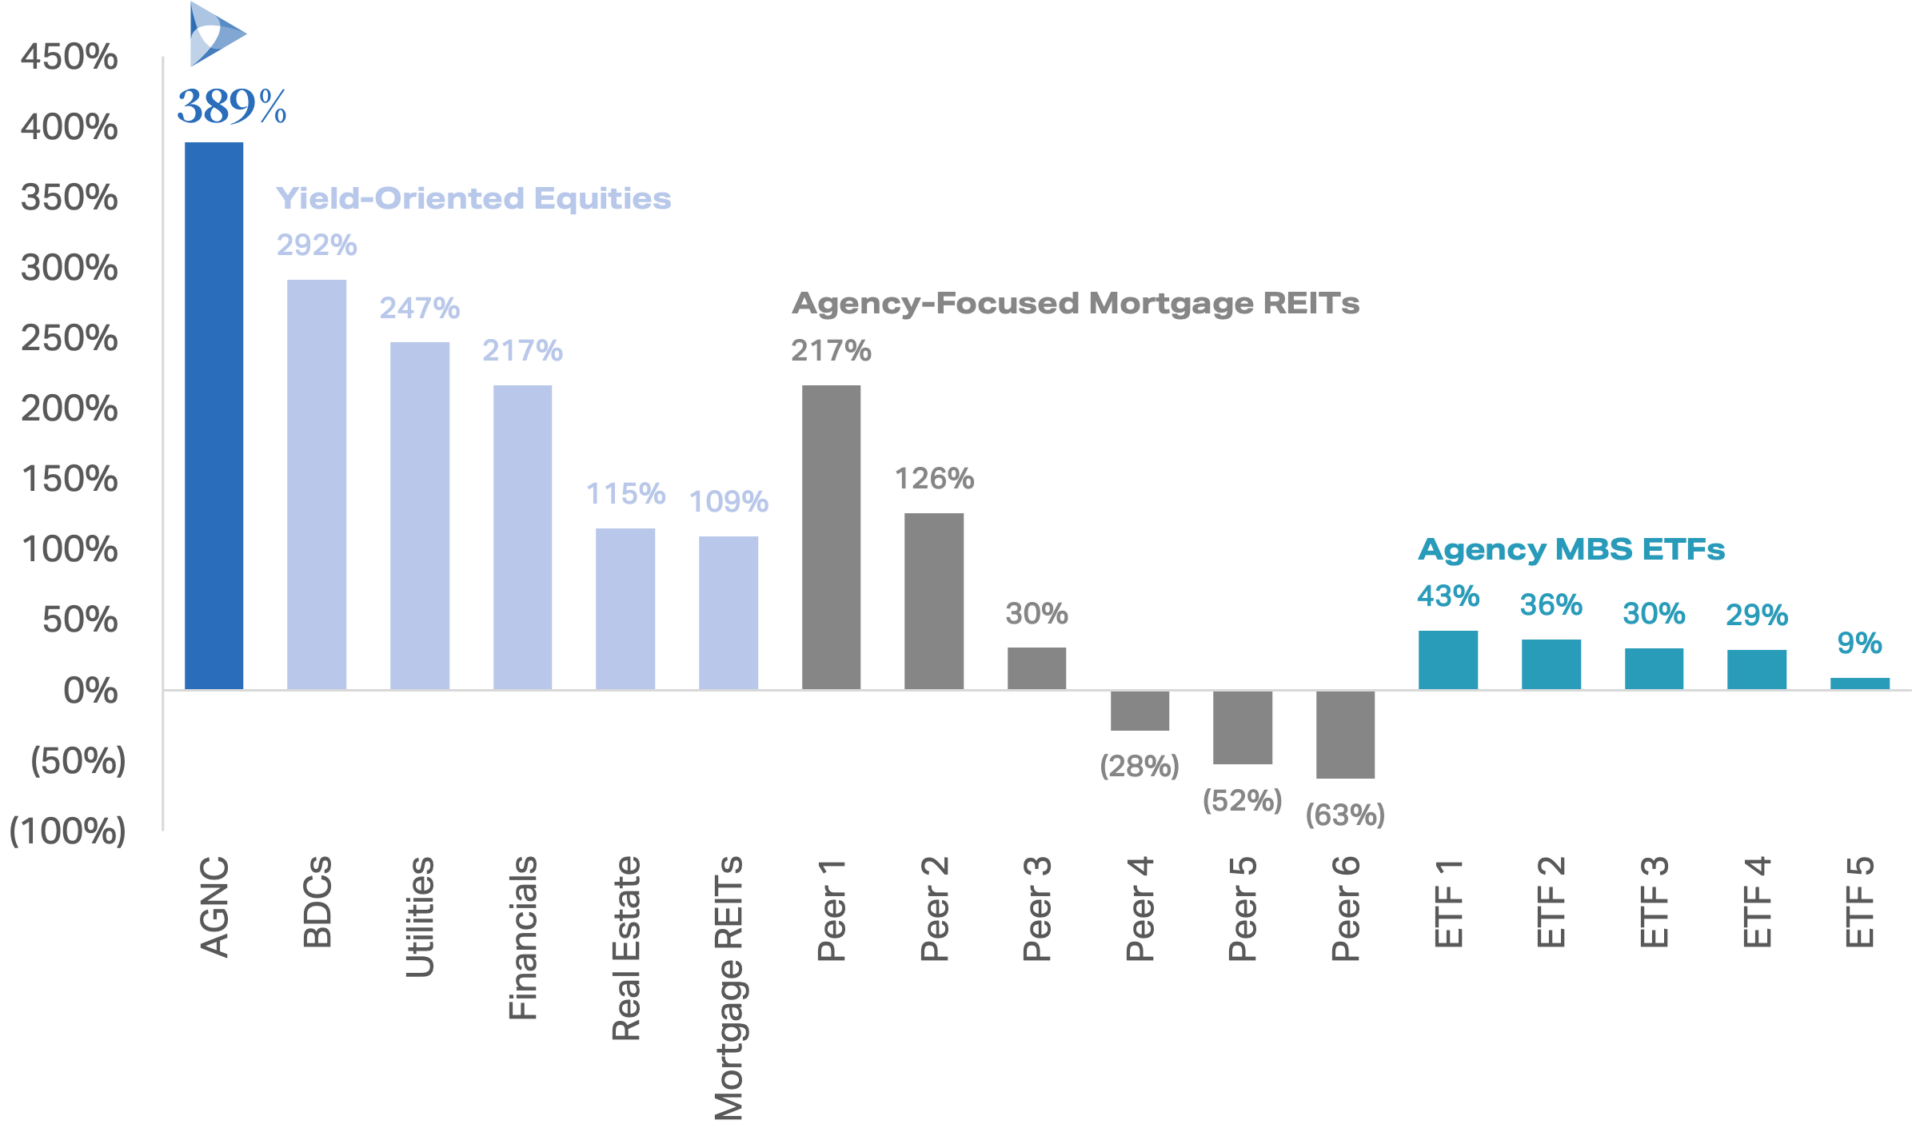
Since our inception in 2008, we have remained steadfastly focused on our primary objective: applying our Agency MBS investment expertise to generate favorable long-term stockholder returns with a substantial dividend yield component. Throughout our 17-year history, we have navigated a myriad of market cycles and exogenous events that have driven numerous periods of significant market volatility. Despite recent prolonged turbulence across the fixed income spectrum, our long-term performance compares very favorably to yield-oriented equity alternatives and other Agency MBS investment vehicles, demonstrating the resilience of our business model and the benefit of being a long-term investor in AGNC.
Total Stock Returns Since AGNC’s May 2008 IPO3
Our strong performance in 2024 underscores the benefits of our proven approach to mortgage investing. We proactively shifted the composition of our asset portfolio, strategically reallocated the mix of our hedges, and generated meaningful book value accretion through opportunistic capital raises. These actions ultimately drove material outperformance of our Agency REIT Peer Group on an economic return basis.2 With a specialized focus on Agency MBS, our team’s ability to select high-quality assets, optimize financing structures, and dynamically manage interest rate and other market risks has created meaningful relative value for AGNC stockholders over the long run.
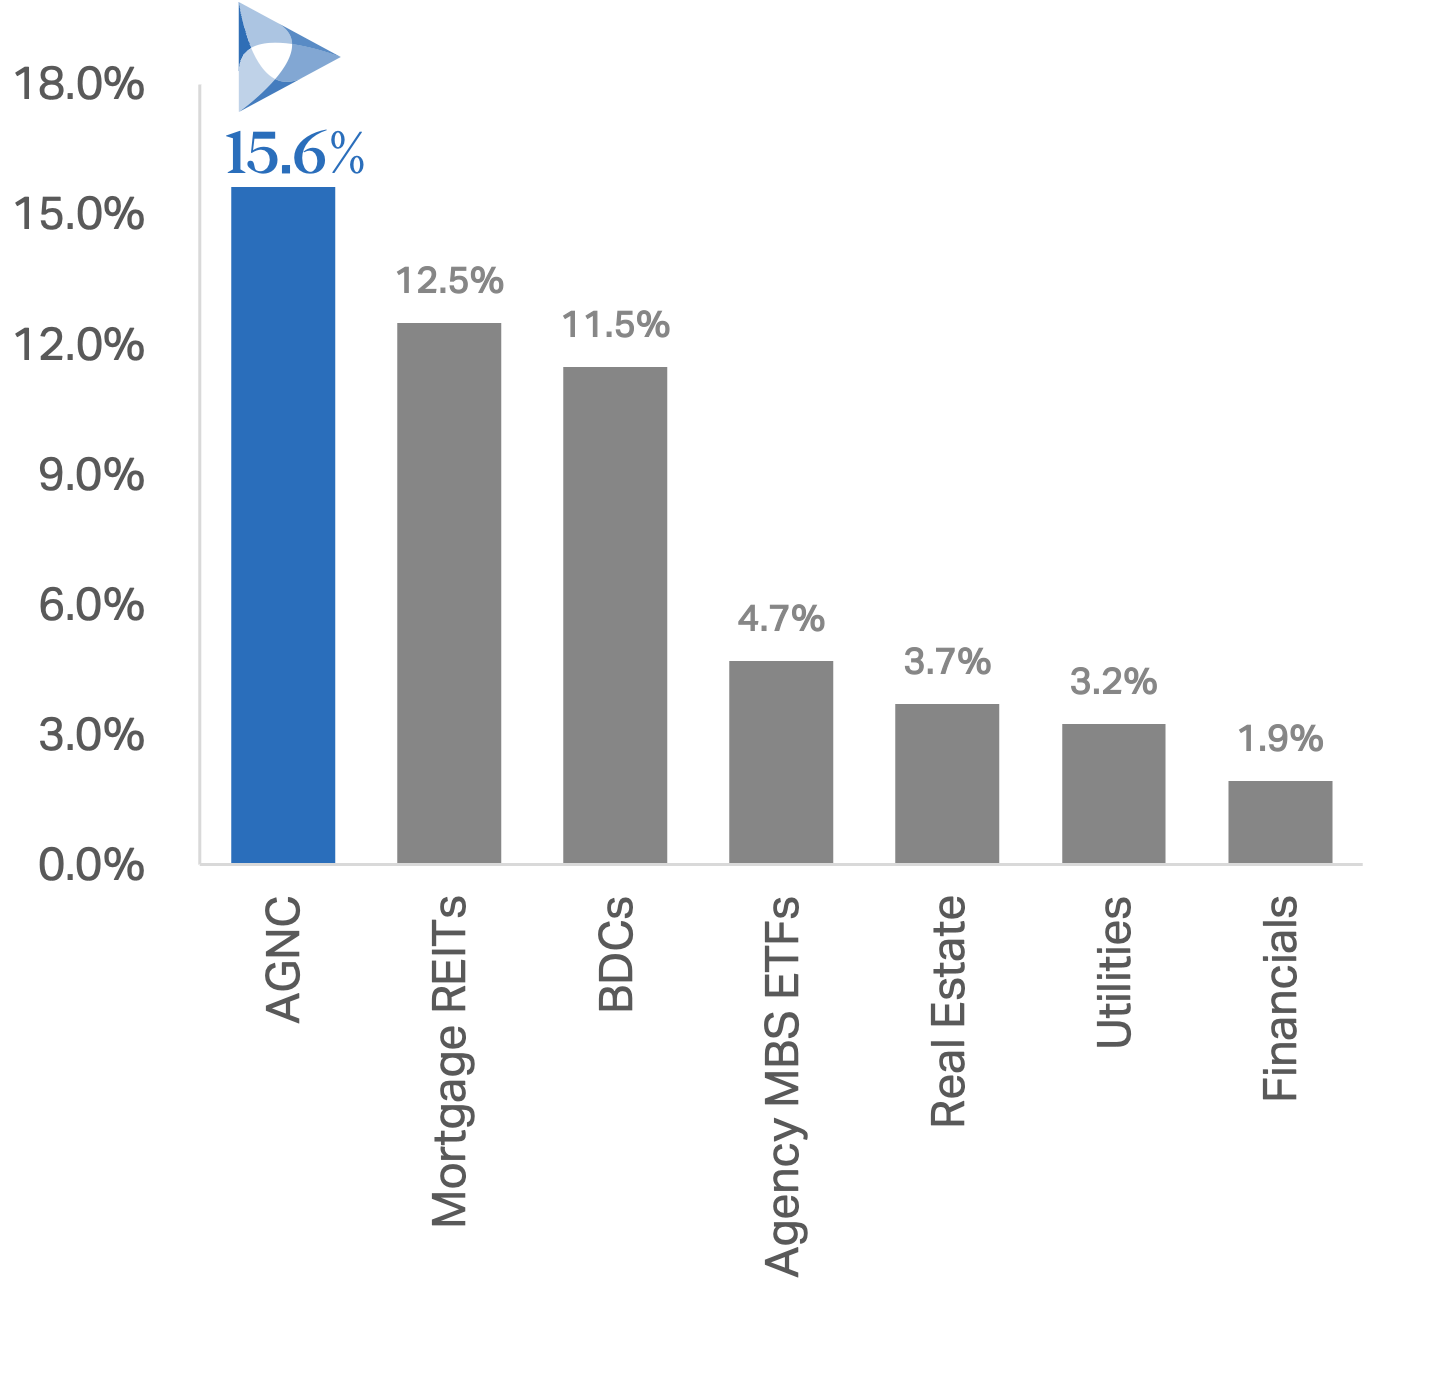
Since inception, AGNC has paid over $14 billion of common stock dividends, and our dividend yield meaningfully exceeds other traditional yield-oriented equity sectors and Agency MBS-centric models. Our common stock dividend, which has remained stable for 59 consecutive months, provides stockholders with attractive current income on a monthly basis.10
Finally, our commitment to responsible stewardship of our stockholders’ capital is unwavering, and our platform provides industry-leading operating efficiency, significant scale, and a long-standing commitment to transparency and stockholder-focused capital management. These stockholder-friendly attributes have contributed to AGNC’s positioning as a best-in-class Agency MBS investor.
Dividend Yields11
Whether an investor is seeking substantial monthly dividend income for a portfolio or a means of accessing the highly attractive investment opportunity in Agency MBS – an asset class that historically has only been available to institutional investors with sophisticated trading platforms – AGNC is an industry-leading solution with a proven track record of success.
As always, we appreciate your continued support of AGNC, and we wish you a healthy and prosperous 2025.
Best regards,

Peter J. Federico
President, Chief Executive Officer & Chief Investment Officer
February 21, 2025
ENDNOTES AND IMPORTANT NOTICES
1. Unless otherwise specified, all data in this letter is presented as of December 31, 2024.
2. When used in this letter, economic return is presented on a per common share basis and represents the sum of the change in tangible net book value per common share and dividends declared on common stock during the period over the beginning tangible net book value per common share. Where shown for comparison purposes, the Agency REIT Peer Group reflects an unweighted average of NLY, ARR, DX, IVR, ORC, and TWO. References to the one year or 2024 period are measured from December 31, 2023 through December 31, 2024. References to the since inception period are measured from June 30, 2008 (the first quarter-end following AGNC’s May 2008 IPO) through December 31, 2024 and are shown on an absolute, unannualized basis; if a company was not publicly traded as of June 30, 2008, its economic return is measured beginning as of its first quarterly reporting date following the date it became publicly traded. Source: Company filings.
3. Total stock return is measured from AGNC’s May 2008 IPO through December 31, 2024; it includes price appreciation and dividend reinvestment, and dividends are assumed to be reinvested at the closing price of the security on the ex-dividend date. Where shown for comparison purposes, sectors reflect the following indices: BDCs (S&P BDC Index), Financials (S&P 500 Financials Index), Mortgage REITs (FTSE NAREIT Mortgage REITs Index), Real Estate (S&P 500 Real Estate Index), and Utilities (S&P 500 Utilities Index). Where shown for comparison purposes, Agency-focused residential mortgage REITs include Annaly Capital Management, Inc. (NLY), ARMOUR Residential REIT, Inc. (ARR), Dynex Capital, Inc. (DX), Invesco Mortgage Capital Inc. (IVR), Orchid Island Capital, Inc. (ORC), and Two Harbors Investment Corp. (TWO), and the Agency REIT Peer Group reflects an unweighted average of NLY, ARR, DX, IVR, ORC, and TWO. Where shown for comparison purposes, Agency MBS ETFs include First Trust Low Duration Opportunities ETF (LMBS), iShares MBS ETF (MBB), Janus Henderson Mortgage-Backed Securities ETF (JMBS), SPDR Portfolio Mortgage-Backed Bond ETF (SPMB), and Vanguard Mortgage-Backed Securities ETF (VMBS), and Agency MBS ETFs reflects an unweighted average of LMBS, MBB, JMBS, SPMB, and VMBS. If a company or ETF shown was not publicly traded as of the date of AGNC’s May 2008 IPO, its total stock return is measured beginning as of the date it became publicly traded. Comparative data provided for informational purposes only. Past performance is not indicative of future results. An investment in AGNC involves different risks and uncertainties from indices, companies, and ETFs cited. Please refer to our annual report on Form 10-K and quarterly reports on Form 10-Q for a more complete description of the risks of our business. Source: Bloomberg.
4. Reflects the federal funds rate upper bound (target range of 5.25-5.50%).
5. MOVE Index reflects the ICE BofA Move Index from December 31, 2008 through December 31, 2024. Source: Bloomberg.
6. U.S. Treasury yield curve reflects month-end Treasury yields for each tenor and month shown. Source: Bloomberg.
7. Agency MBS spread to U.S. Treasuries and Agency MBS spread to swaps reflect the 30-year current coupon Agency MBS yield spread to a 50/50 average of 5- and 10-year U.S. Treasury yields and a 50/50 average of 5- and 10-year SOFR OIS swaps, respectively, from December 31, 2008 through December 31, 2024. Source: Bloomberg.
8. Differential reflects the difference between the Agency MBS spread (as represented by the FNMA 30-year current coupon Z-spread) and the investment grade corporate bond spread (as represented by the Bloomberg U.S. Corporate Bond Index Z-spread) from December 31, 2008 through December 31, 2024. Values below -400 basis points have been excluded from the chart for scaling purposes. Source: Bloomberg and JP Morgan.
9. Agency MBS ownership composition data reflects approximate ownership based on the most recently available holdings data for each ownership category as of each year-end shown; private capital investors includes money managers, overseas, and REITs. Source: JP Morgan.
10. Information in this paragraph is as of the date of this letter (February 21, 2025).
11. Dividend yields as of December 31, 2024. Where shown for comparison purposes, sectors reflect the following indices: Mortgage REITs (FTSE NAREIT Mortgage REITs Index), BDCs (S&P BDC Index), Real Estate (S&P 500 Real Estate Index), Utilities (S&P 500 Utilities Index), and Financials (S&P 500 Financials Index). Agency MBS ETFs reflects an unweighted average of LMBS, MBB, JMBS, SPMB, and VMBS. Comparative data provided for informational purposes only. Past performance is not indicative of future results. An investment in AGNC involves different risks and uncertainties from indices, companies, and ETFs cited. Please refer to our annual report on Form 10-K and quarterly reports on Form 10-Q for a more complete description of the risks of our business. Source: Bloomberg.
IMPORTANT NOTICE: “AGNC,” the “Company,” “we,” “us,” or “our” refers to AGNC Investment Corp. This letter is an excerpt from our 2024 Annual Report, which is available in the Investor Relations section of our website. Our 2024 Annual Report contains forward-looking statements within the meaning of the Private Securities Litigation Reform Act. Forward-looking statements are based on estimates, projections, beliefs, and assumptions of management of the Company at the time of such statements and are not guarantees of future performance. As further described in the Management Discussion and Analysis included in our 2024 Annual Report, forward-looking statements involve risks and uncertainties in predicting future results and conditions. Actual results could differ materially from those projected in these forward-looking statements or from our historic performance due to a variety of important factors.