monthly macro monitor
key trends for the agency mbs investor
march 2025
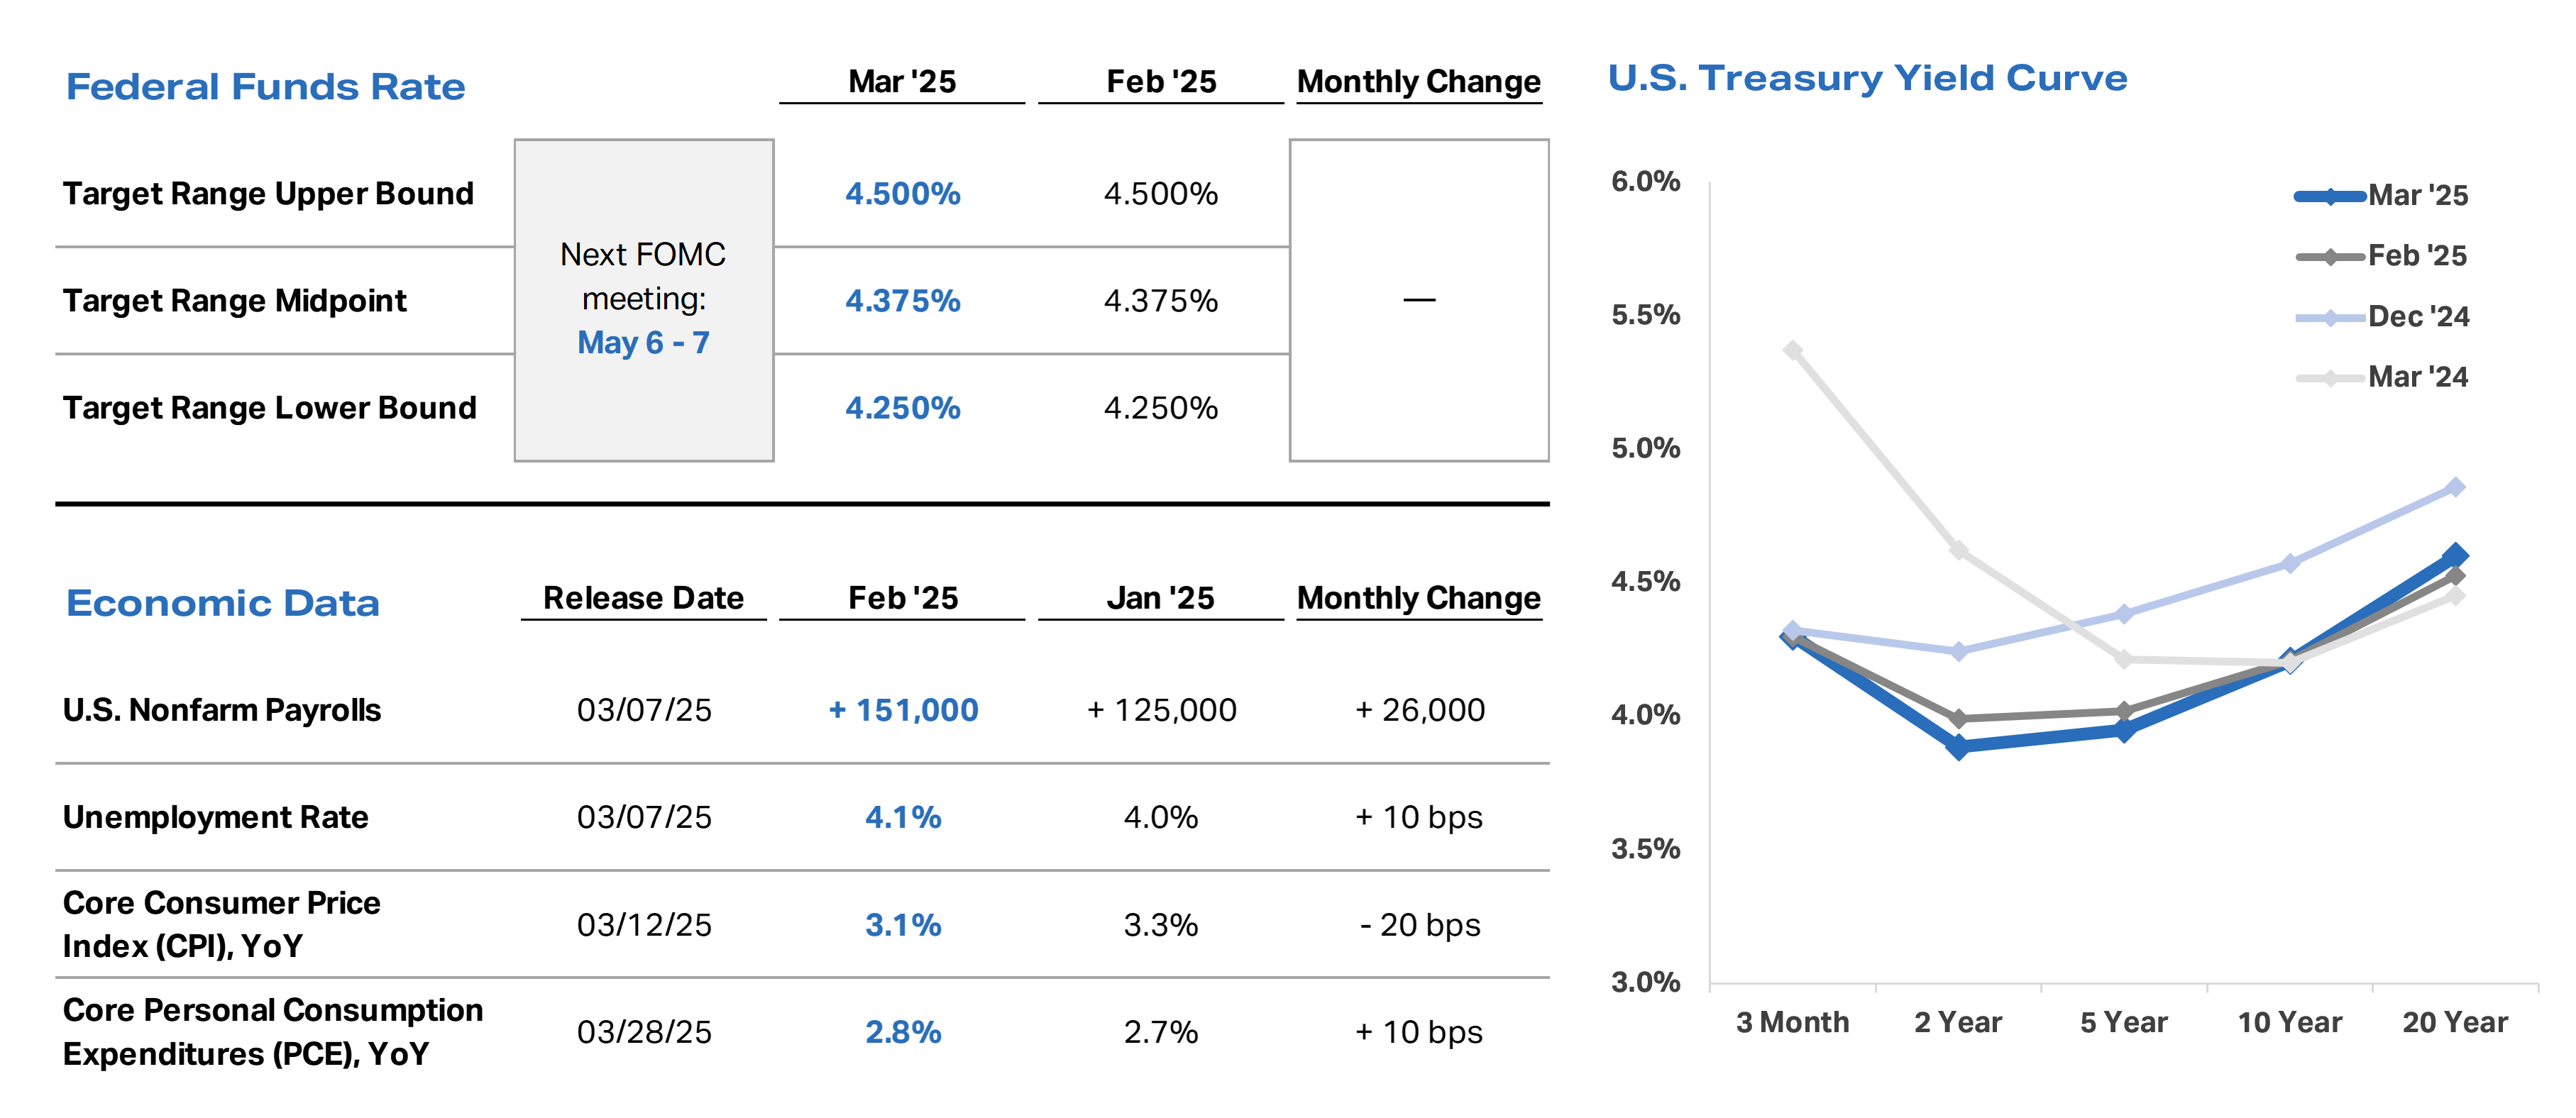
- Inflation measures released in March were once again mixed. February Core CPI was below consensus estimates and January levels, but Core PCE posted its largest monthly increase since January 2024. Weak consumer confidence and spending readings also indicated potentially weaker economic growth in the months ahead.
- Inflationary uncertainty and negative economic indicators, combined with the impending implementation of the administration’s tariffs, ignited concerns of a potential stagflation environment in the coming months.
- As a result of these factors, we believe that the Fed will maintain its wait-and-see approach to monetary policy over the course of its next several meetings as it assesses incoming economic data and the impacts of new government policy.
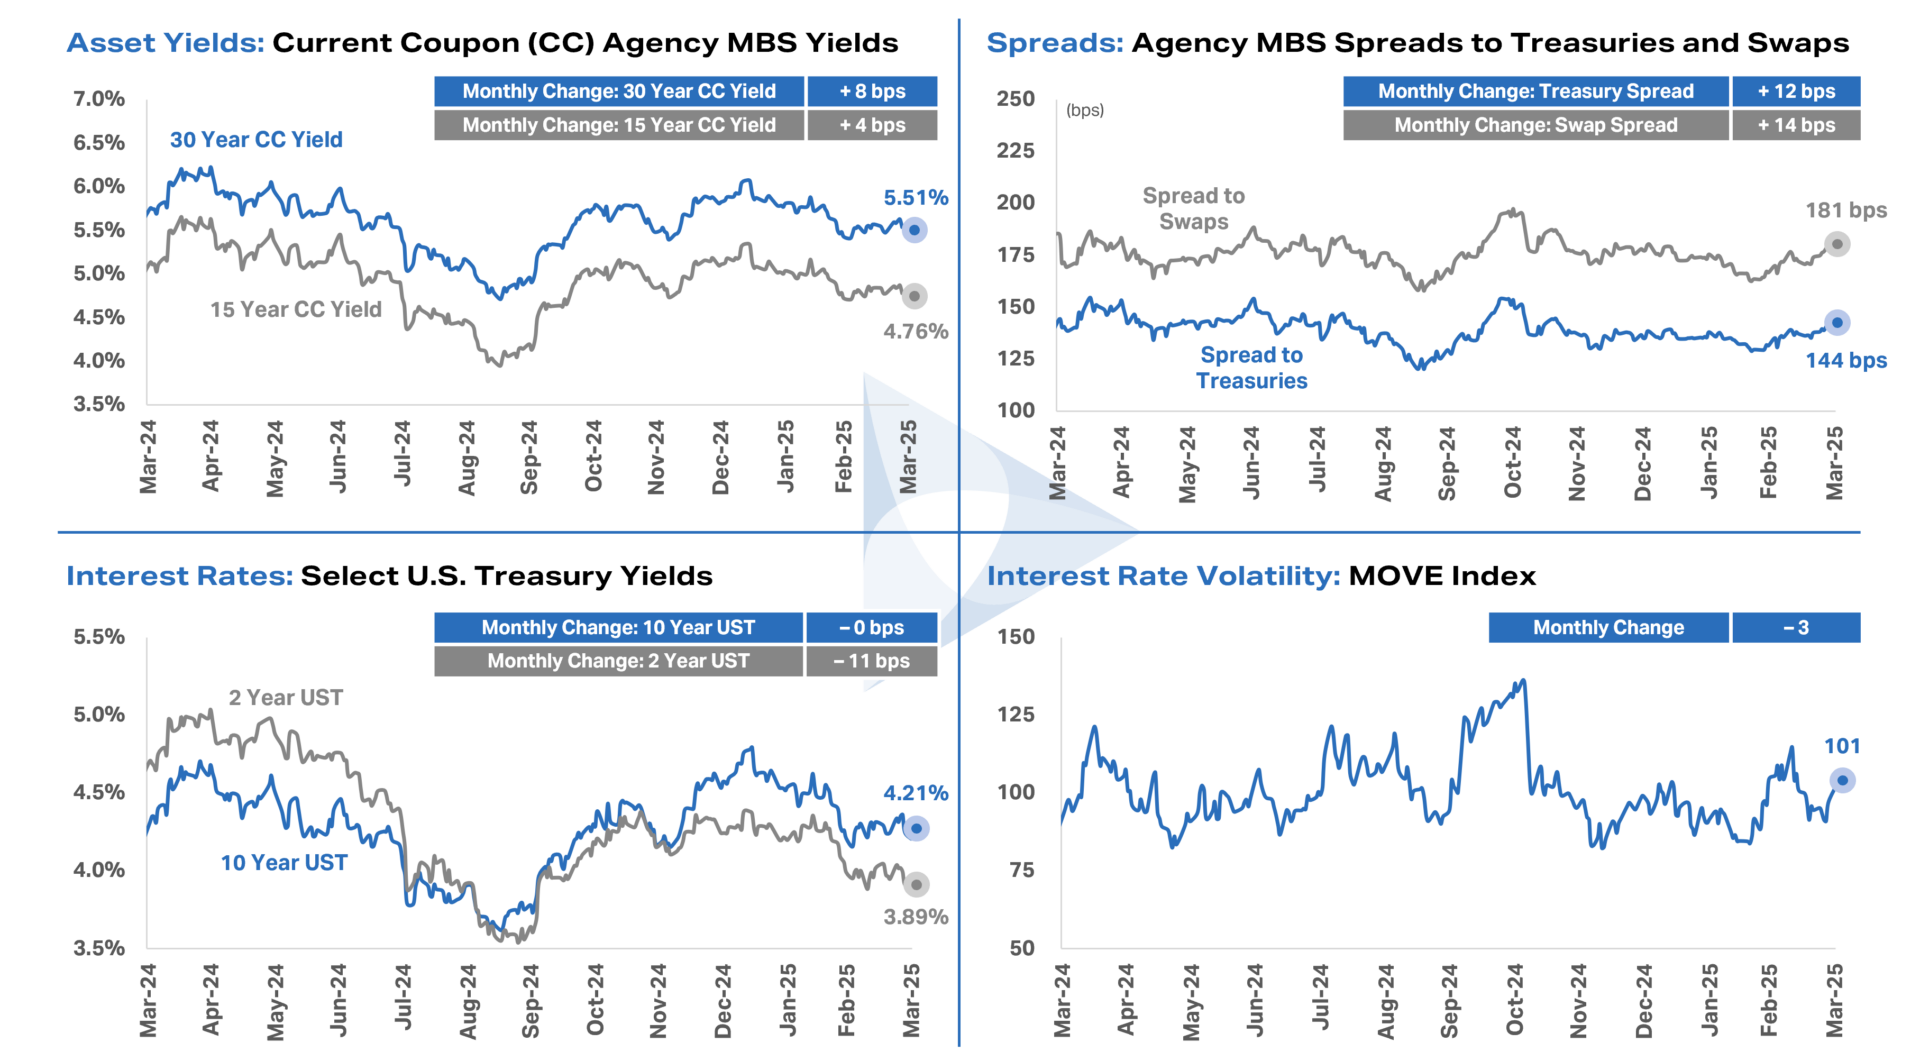
- Agency MBS spreads to benchmark rates widened modestly in March, with much of the move occurring in the last week of the month. Importantly, Agency MBS continue to trade within the relatively narrow spread range that emerged in 2023.
- At current spread levels, Agency MBS investments offer attractive return opportunities both on an absolute basis and relative to the broader fixed income universe. To the extent macroeconomic uncertainty drives a flight to quality, we believe assets like Agency MBS, which benefit from explicit government support, could outperform credit-centric fixed income assets.
Key Rate and Spread trends
Important Disclosures
Federal funds rate data last updated March 31, 2025. Source: Federal Reserve.
Economic data last updated March 31, 2025. Core CPI and Core PCE exclude food and energy. Source: Bureau of Labor Statistics and Bureau of Economic Analysis.
U.S. Treasury yield curve reflects month-end Treasury yields for each tenor and month shown. Source: Bloomberg.
Agency MBS spread to U.S. Treasuries and Agency MBS spread to swaps reflect the 30-year current coupon Agency MBS yield spread to a 50/50 average of 5- and 10-year U.S. Treasury yields and a 50/50 average of 5- and 10-year SOFR OIS swaps, respectively. MOVE Index reflects the ICE BofA Move Index. Each chart is shown over the trailing 12 months ended March 31, 2025, and each monthly change reflects the difference between March 2025 month-end data and February 2025 month-end data. Source: Bloomberg.
Data and commentary, including thoughts, opinions, and outlook of AGNC Investment Corp. (“AGNC”) management, are provided for information purposes only and should not be construed as investment advice.
Investment in AGNC involves risks and uncertainties that may cause future performance to vary from historical results or any forward-looking commentary provided. Please refer to our annual and quarterly reports on file with the SEC and available on our website or at www.sec.gov for more information about AGNC, including material risks, other factors that may affect future performance, and notices regarding forward-looking statements. AGNC disclaims any obligation to update or revise any forward-looking commentary. Stockholders and other interested parties may sign up to receive AGNC’s news, perspectives, and other types of email alerts by clicking the Subscribe link below.