agency mbs: asset class benefits
A Favorable Building Block for Any Portfolio
Agency MBS assets benefit from compelling fundamentals and favorable attributes that make them an important building block of a well-diversified investment portfolio.
differentiated asset
The Agency MBS market is considered a pillar of the U.S. financial system, as it plays a vital role in ensuring the uninterrupted availability of 30-year mortgages to American homeowners throughout market cycles. The $48 trillion housing market is supported by over $13 trillion of mortgage debt across the nation, over 65% of which is held in the form of Agency MBS.1
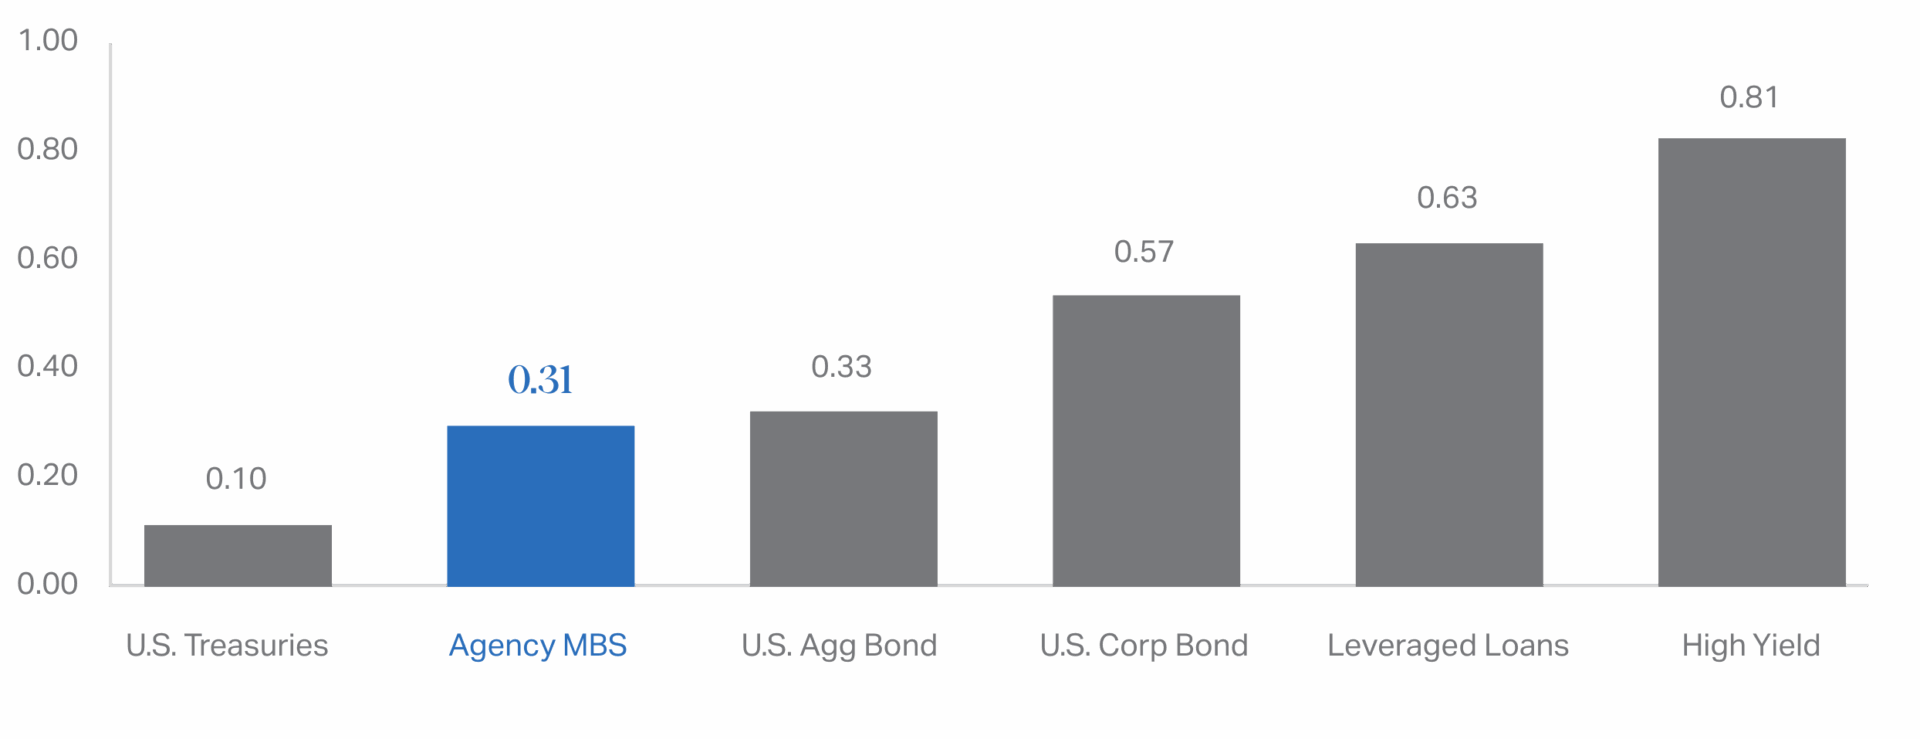
The performance of Agency MBS has historically been relatively uncorrelated to the performance of both U.S. equities and other fixed income assets. This dynamic provides meaningful diversification benefits for multi-asset portfolios, particularly during periods of market volatility.
Fixed Income Correlation to U.S. Equities2
(Correlation Coefficient)
government support
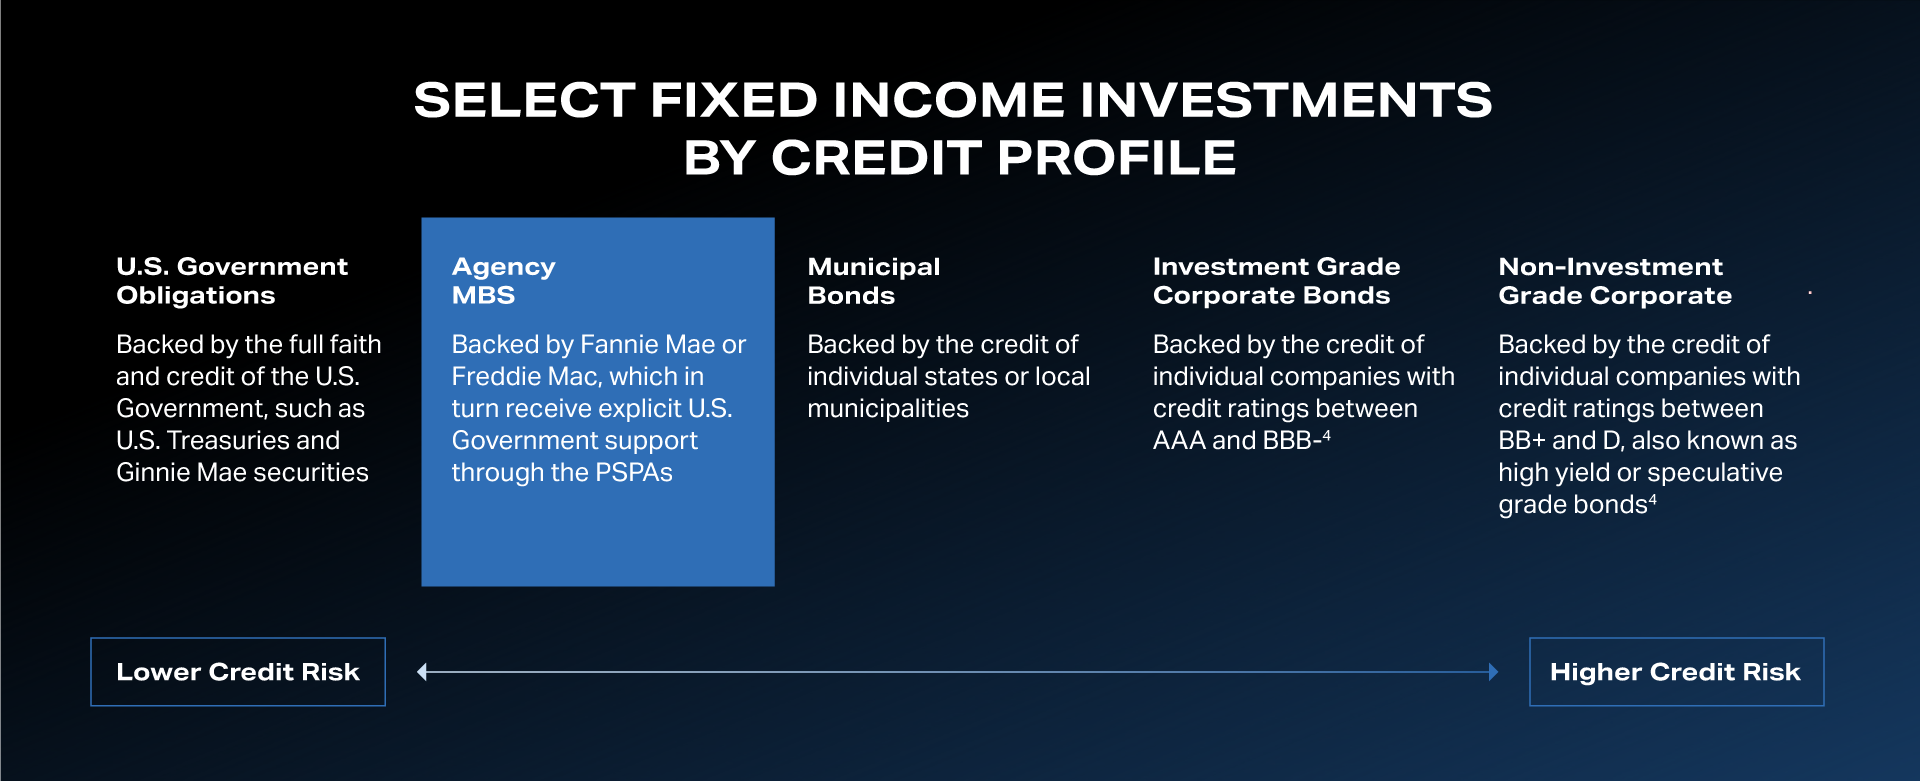
The principal and interest payments on Agency MBS are guaranteed by one of three Agencies: Fannie Mae or Freddie Mac, which are U.S. Government-sponsored enterprises (GSEs), or Ginnie Mae, a U.S. Government agency. In the event borrowers default on their mortgages, these Agencies ensure the timely payment of principal and interest to security holders to make them whole for any missed borrower payment(s).3
The GSEs benefit from a substantial U.S. Government capital commitment through the Preferred Stock Purchase Agreements (PSPAs) implemented following the Great Financial Crisis, and Ginnie Mae securities carry the full faith and credit guarantee of the U.S. Government. This explicit U.S. Government support creates a risk profile similar to that of U.S. Treasuries – which are backed by the full faith and credit of the U.S. Government – and substantially eliminates credit risk for Agency MBS investors.
Agency MBS combine this superior credit profile with attractive yield potential to create a powerful diversification tool across market cycles, particularly when periods of market stress drive a flight to high quality fixed income assets.
substantial yield opportunity
Investors earn current income from Agency MBS as individual borrowers make monthly payments of principal and interest on the underlying mortgage loans, which are in effect “passed through” to the security holders on a pro rata basis. New production 30-year Agency MBS offer asset yields of 5-6% in the current market environment.5
Specialized investors like AGNC seek to enhance return potential by utilizing highly liquid, short-term repurchase agreements (repo) to fund asset purchases. Repo funding is available at extremely attractive rates due to the high investment quality, market liquidity, and government support of Agency MBS.
The timing mismatch between the longer-term Agency MBS asset yield and short-term repo funding creates interest rate risk in a levered Agency MBS portfolio. As such, AGNC employs hedging strategies to more closely align the duration of asset and liability cash flows that are intended to protect the value of the portfolio from significant interest rate moves. Primary hedging instruments typically include interest rate swaps, swaptions, short U.S. Treasury positions, and U.S. Treasury futures.
This approach is intended to allow AGNC to capture the difference, or spread, between the asset yield and the cost of funding on a levered and hedged basis.
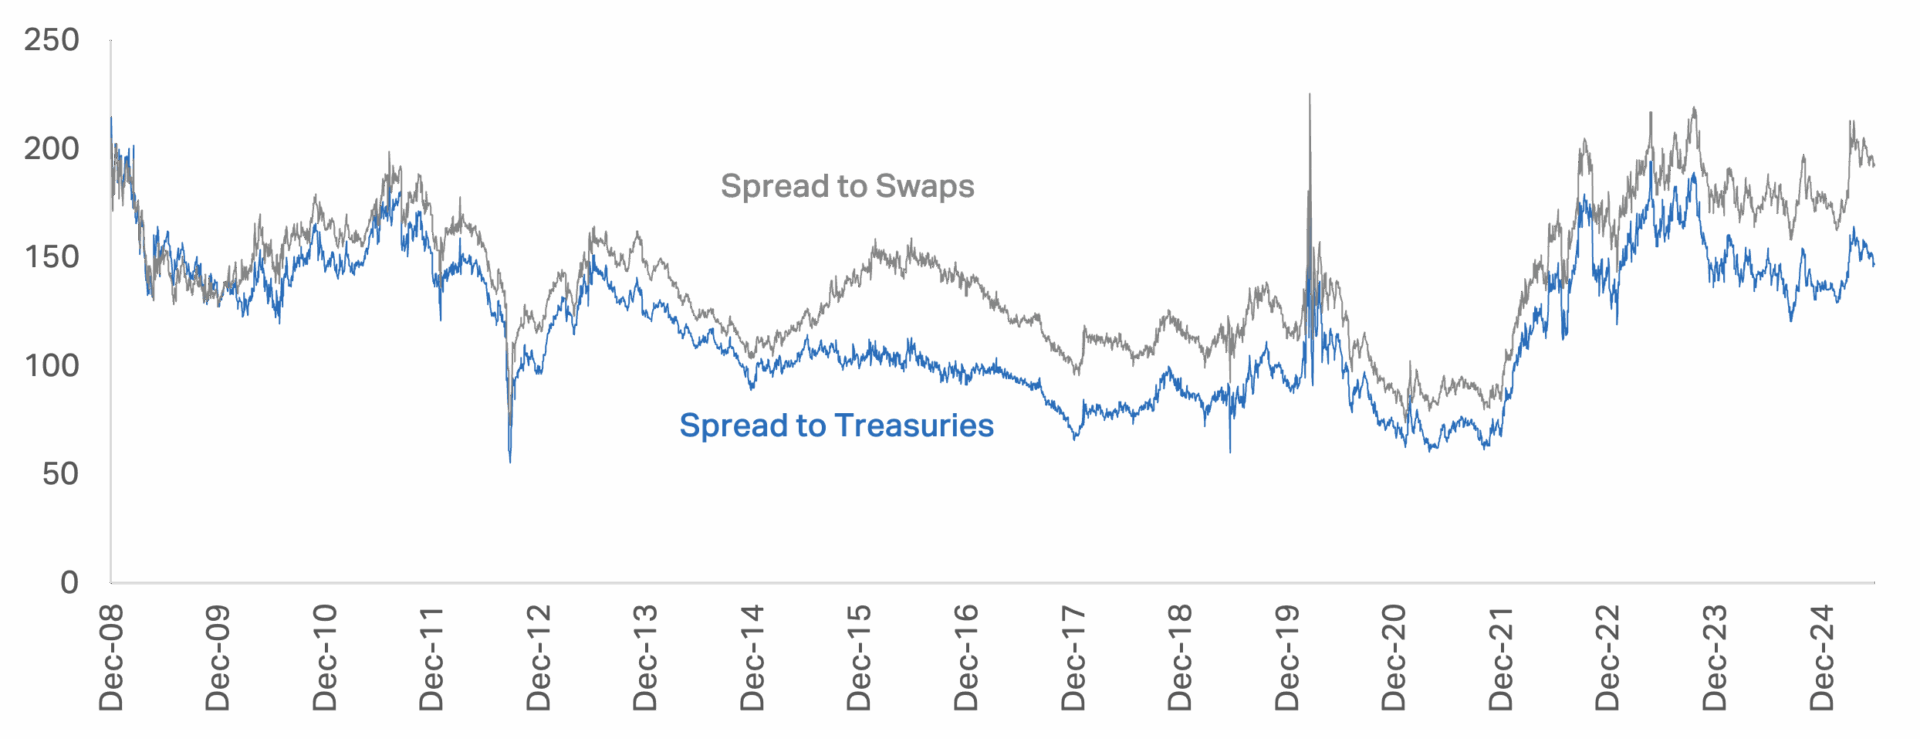
Agency MBS Spreads6
(Basis Points)
highly liquid market
The Agency MBS market is a massive fixed income asset class with substantial trading liquidity, second only to the U.S. Treasury market. Fannie Mae, Freddie Mac, and Ginnie Mae bundle and guarantee millions of conforming mortgages originated by U.S. lenders each year – the Agency MBS market stood at $9.2 trillion as of year-end and saw over $300 billion of average daily trading volume in 2024.7
$9.2T
AGENCY MBS MARKET SIZE7
$310B
AGENCY MBS AVERAGE DAILY TRADING VOLUME7
Despite its size and liquidity, the Agency MBS market is difficult for many retail investors to access through traditional channels, as it is primarily available to institutional investors with sophisticated trading platforms. AGNC provides our stockholders access to this asset class – and its favorable attributes – through an industry-leading platform that pairs compelling risk-adjusted returns with a stockholder-focused approach.
$78.9B
AGNC INVESTMENT PORTFOLIO8
96%
AGNC PORTFOLIO ALLOCATION TO FIXED RATE AGENCY MBS8
IMPORTANT NOTICES AND DISCLOSURES
1. As of December 31, 2024. Source: Urban Institute.
2. Approximate correlations to U.S. equities reflect the five year correlation coefficient of each of the following indexes to the S&P 500 Index, calculated on a weekly basis, from December 31, 2019 through December 31, 2024: Bloomberg U.S. MBS Index (Agency MBS), Bloomberg U.S. Treasury 3-10 Year Index (U.S. Treasuries), Bloomberg U.S. Aggregate Bond Index (U.S. Agg Bond), Bloomberg U.S. Credit Corp 5-10 Year Total Return Index (U.S. Corp Bond), Morningstar LSTA U.S. Leveraged Loan 100 Index (Leveraged Loans), and Bloomberg U.S. Corporate High Yield Bond Index (High Yield). Source: Bloomberg.
3. The Federal National Mortgage Association (Fannie Mae) and the Federal Home Loan Mortgage Corporation (Freddie Mac) are U.S. Government-sponsored enterprises (GSEs) that issue and guarantee mortgage-backed securities (MBS). The Government National Mortgage Association (Ginnie Mae) is a U.S. Government agency that guarantees MBS issued by approved lenders who participate in its programs. These three entities are collectively referred to as the “Agencies,” and the mortgage-backed securities that are guaranteed by one of these three entities are “Agency MBS.”
4. Credit ratings shown reflect the rating scale used by S&P and Fitch. The Moody’s credit rating scale ranges from Aaa to C.
5. As of June 2025. Source: Bloomberg.
6. Agency MBS spread to U.S. Treasuries and Agency MBS spread to swaps reflect the 30-year current coupon Agency MBS yield spread to a 50/50 average of 5- and 10-year U.S. Treasury yields and a 50/50 average of 5- and 10-year SOFR OIS swaps, respectively, from December 31, 2008 through June 30, 2025. Source: Bloomberg.
7. Market size as of December 31, 2024, and average daily trading volume reflects the twelve-month period ended December 31, 2024. Source: Urban Institute and SIFMA.
8. As of March 31, 2025.
This article was originally published on July 14, 2025, and all information provided and any forward-looking statements made are only as of this date, unless otherwise indicated. Data and commentary, including any thoughts, opinions, and outlook of AGNC Investment Corp. (“AGNC”), are provided for information purposes only and should not be construed as investment advice.
Investment in AGNC involves risks and uncertainties that may cause future performance to vary from historical results or any forward-looking commentary provided. Please refer to our annual and quarterly reports on file with the SEC and available on our website or at www.sec.gov for more information about AGNC, including material risks, other factors that may affect future performance, and notices regarding forward-looking statements. AGNC disclaims any obligation to update or revise any forward-looking commentary. Stockholders and other interested parties may sign up to receive AGNC’s news, perspectives, and other types of email alerts by clicking the Subscribe link below.