monthly macro monitor
key trends for the agency mbs investor
JULY 2025
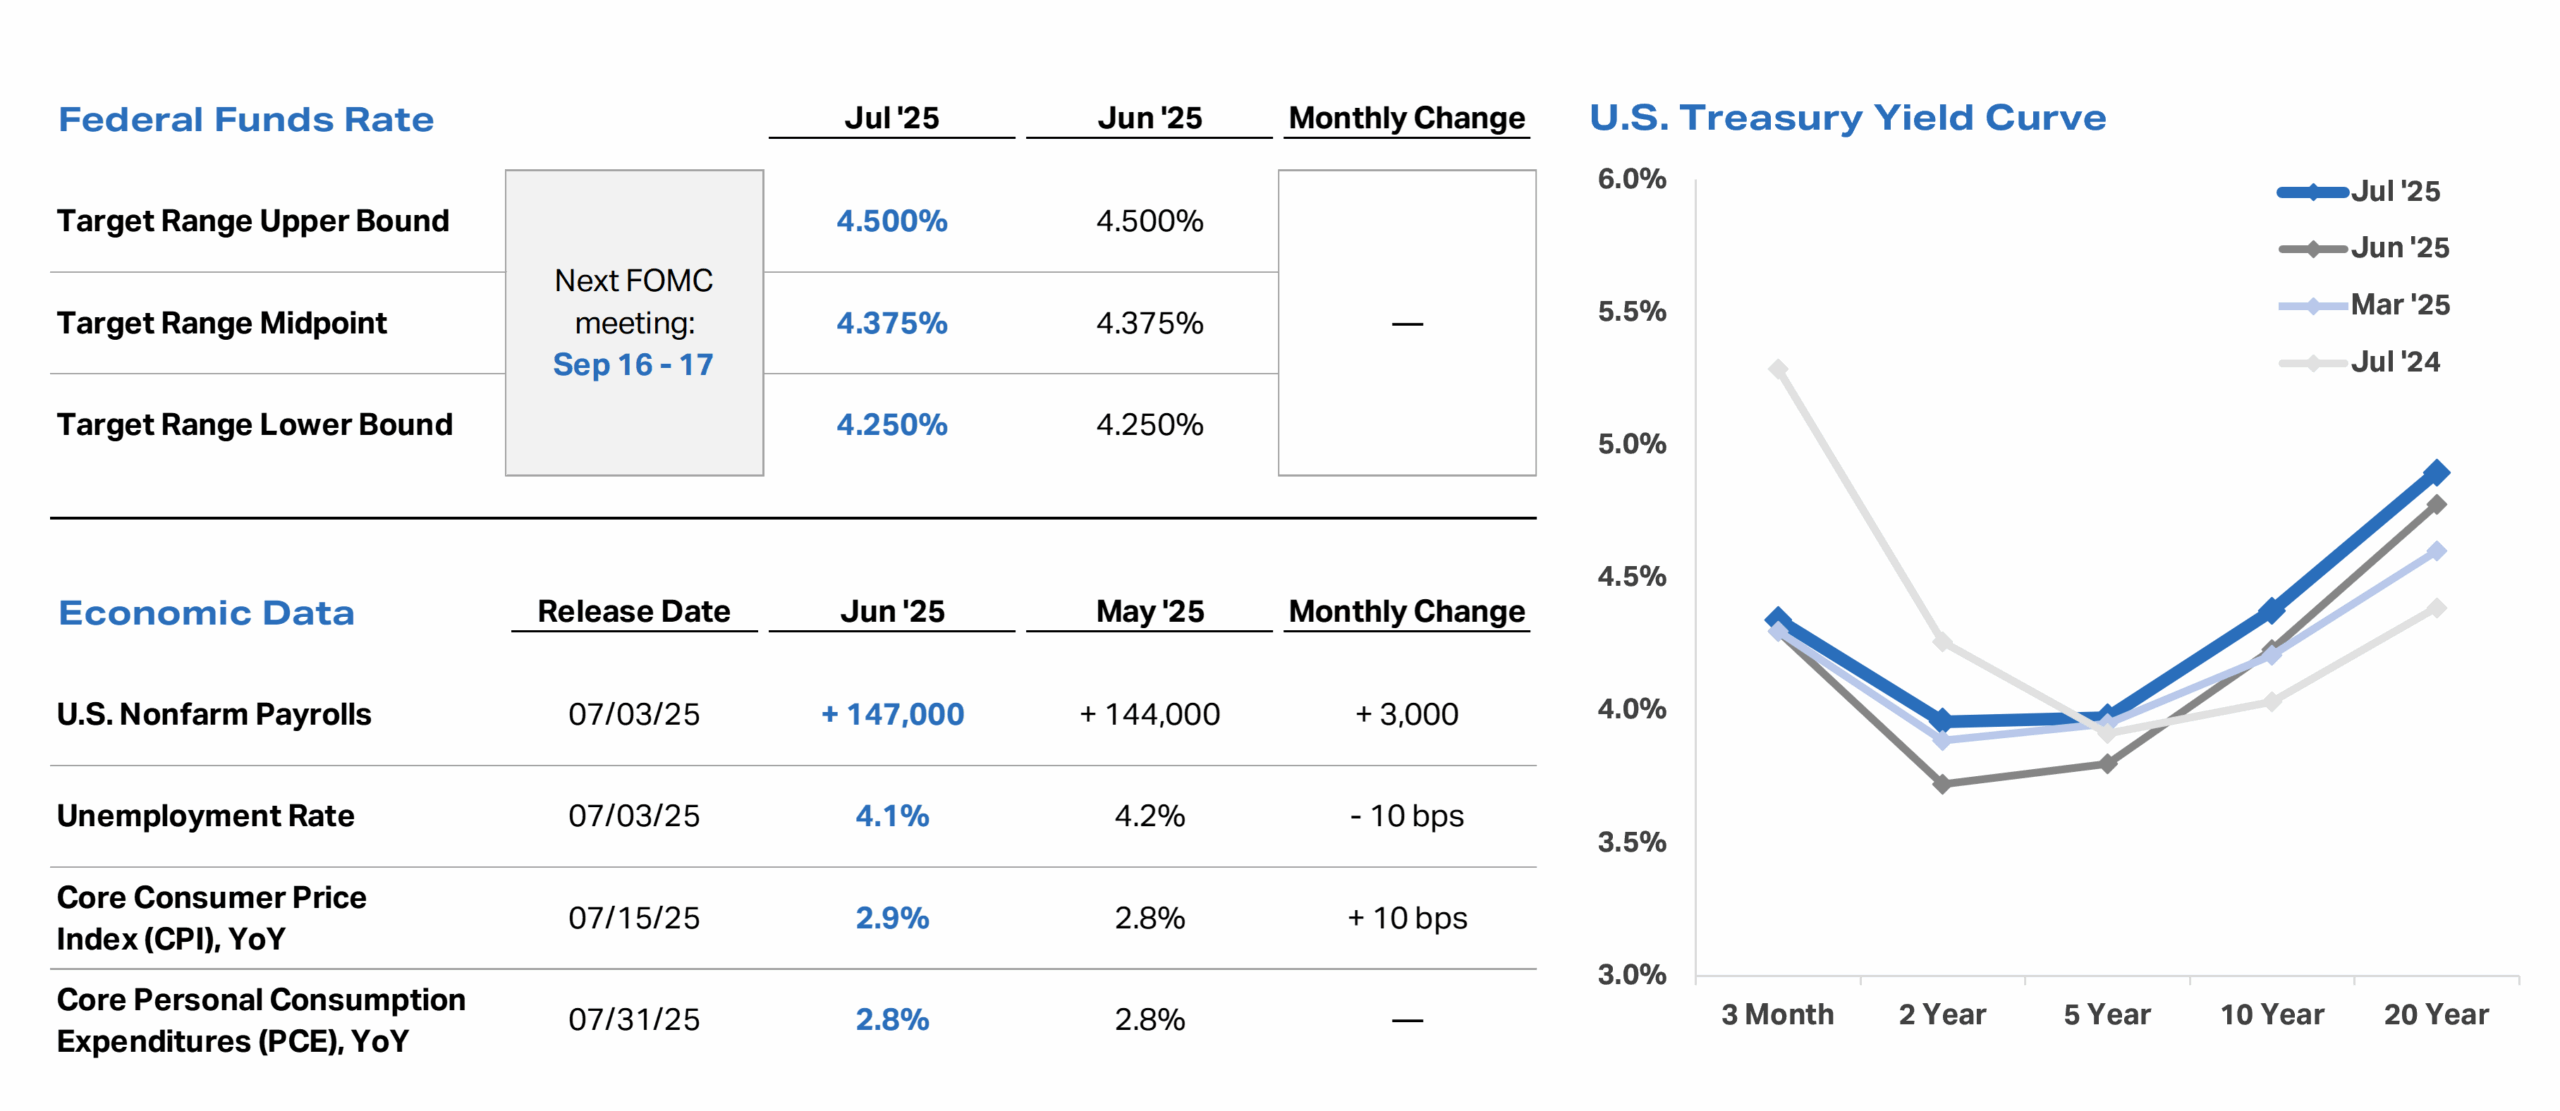
- Employment measures released in July were relatively unchanged on a month-over-month basis and continued to show favorable trends relative to consensus estimates: nonfarm payrolls exceeded the median estimate, and the unemployment rate was below the median estimate.
- The July employment report released on August 1, however, included major downward revisions to May and June nonfarm payrolls of -125,000 and -133,000, respectively. These revisions are not reflected in the economic data table shown below, which provides information released in July.
- Inflation measures released in July were generally consistent with consensus estimates and relatively unchanged on a month-over-month basis, as inflation continues to track somewhat above the Fed’s 2% long-term objective.
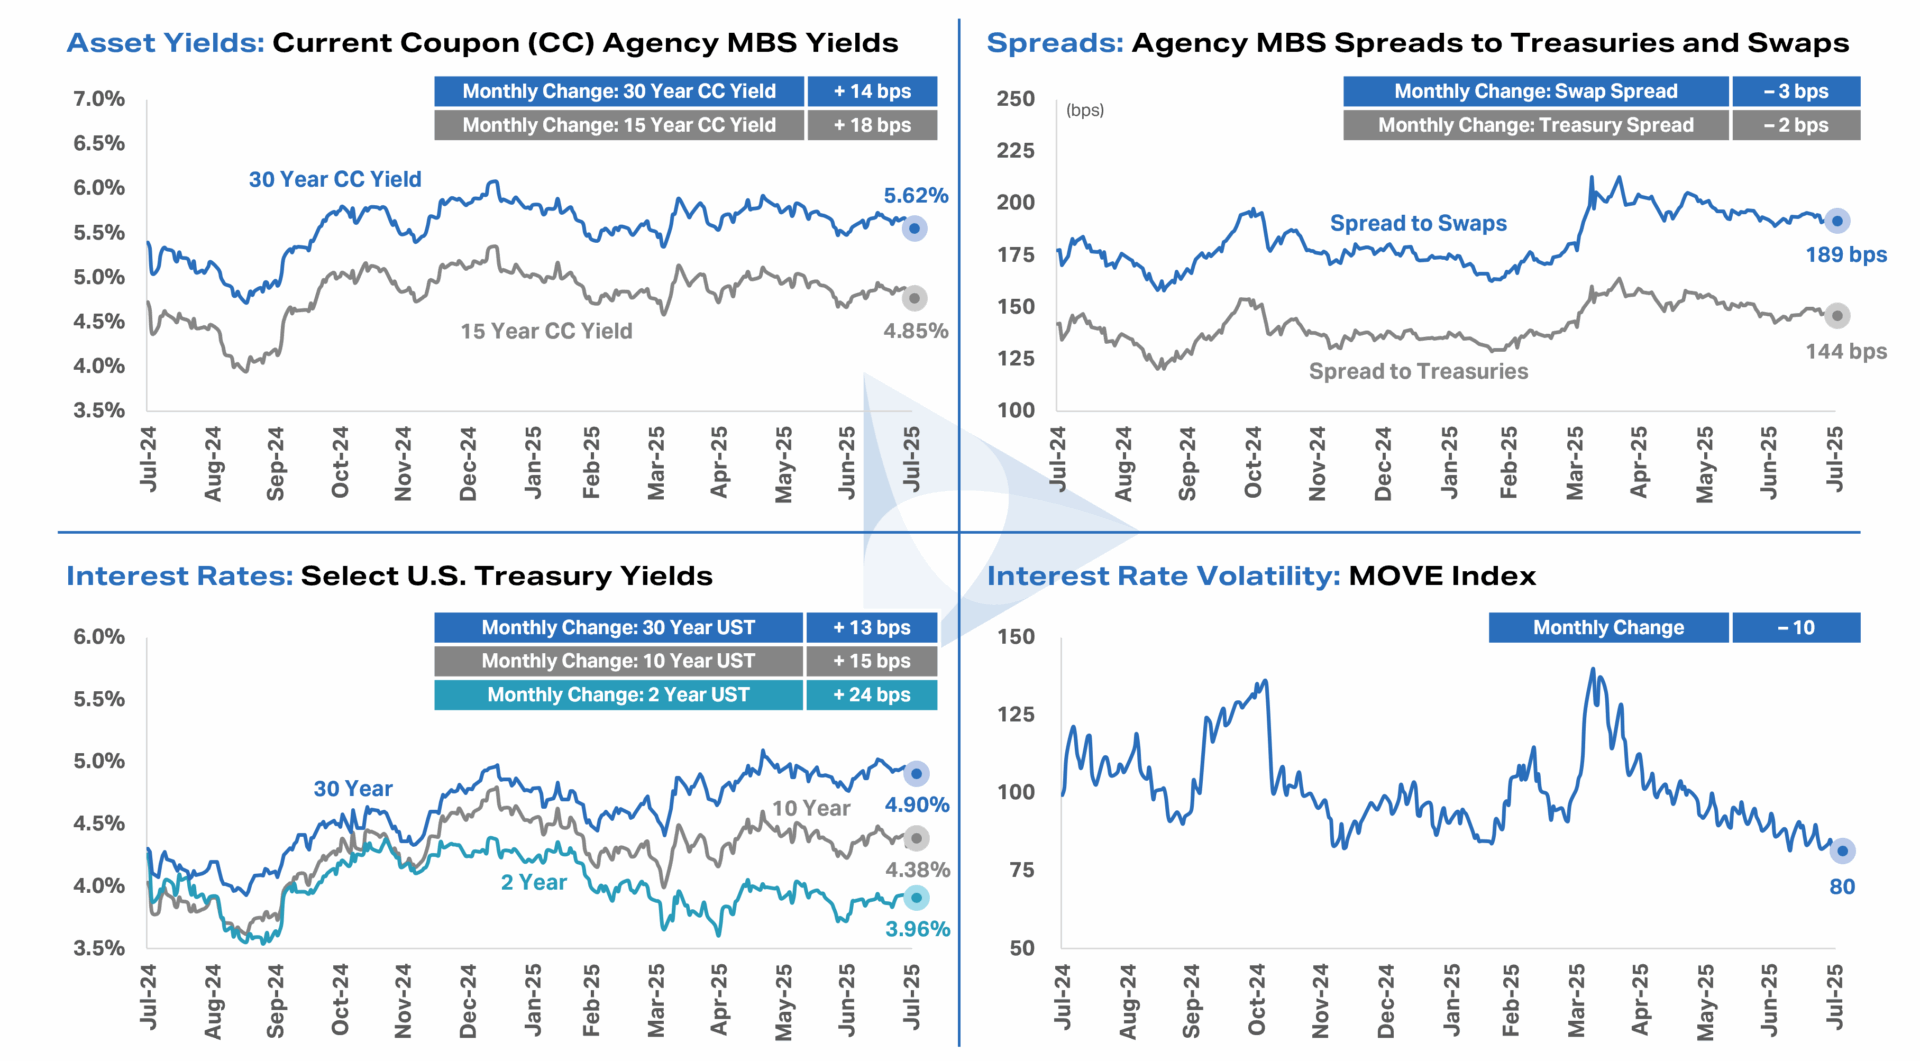
- Benchmark interest rates increased across the curve in July, the yield curve flattened, and interest rate volatility continued to decline from April highs.
- While Agency MBS spreads to benchmark rates tightened modestly during the month, they continue to remain elevated by historical standards as macroeconomic uncertainty persists. This dynamic, coupled with the fact that spreads have remained range-bound, continues to present an extremely favorable return environment for Agency MBS investors.
Key Rate and Spread trends
Important Disclosures
Federal funds rate data last updated July 31, 2025. Source: Federal Reserve.
Economic data last updated July 31, 2025. Core CPI and Core PCE exclude food and energy. Source: Bureau of Labor Statistics and Bureau of Economic Analysis.
U.S. Treasury yield curve reflects month-end Treasury yields for each tenor and month shown. Source: Bloomberg.
Agency MBS spread to U.S. Treasuries and Agency MBS spread to swaps reflect the 30-year current coupon Agency MBS yield spread to a 50/50 average of 5- and 10-year U.S. Treasury yields and a 50/50 average of 5- and 10-year SOFR OIS swaps, respectively. MOVE Index reflects the ICE BofA Move Index. Each chart is shown over the trailing 12 months ended July 31, 2025, and each monthly change (rounded to the nearest whole number) reflects the difference between July 2025 month-end data and June 2025 month-end data. Source: Bloomberg.
Data and commentary, including thoughts, opinions, and outlook of AGNC Investment Corp. (“AGNC”) management, are provided for information purposes only and should not be construed as investment advice.
Investment in AGNC involves risks and uncertainties that may cause future performance to vary from historical results or any forward-looking commentary provided. Please refer to our annual and quarterly reports on file with the SEC and available on our website or at www.sec.gov for more information about AGNC, including material risks, other factors that may affect future performance, and notices regarding forward-looking statements. AGNC disclaims any obligation to update or revise any forward-looking commentary. Stockholders and other interested parties may sign up to receive AGNC’s news, perspectives, and other types of email alerts by clicking the Subscribe link below.