monthly macro monitor
key trends for the agency mbs investor
SEPTEMBER 2025
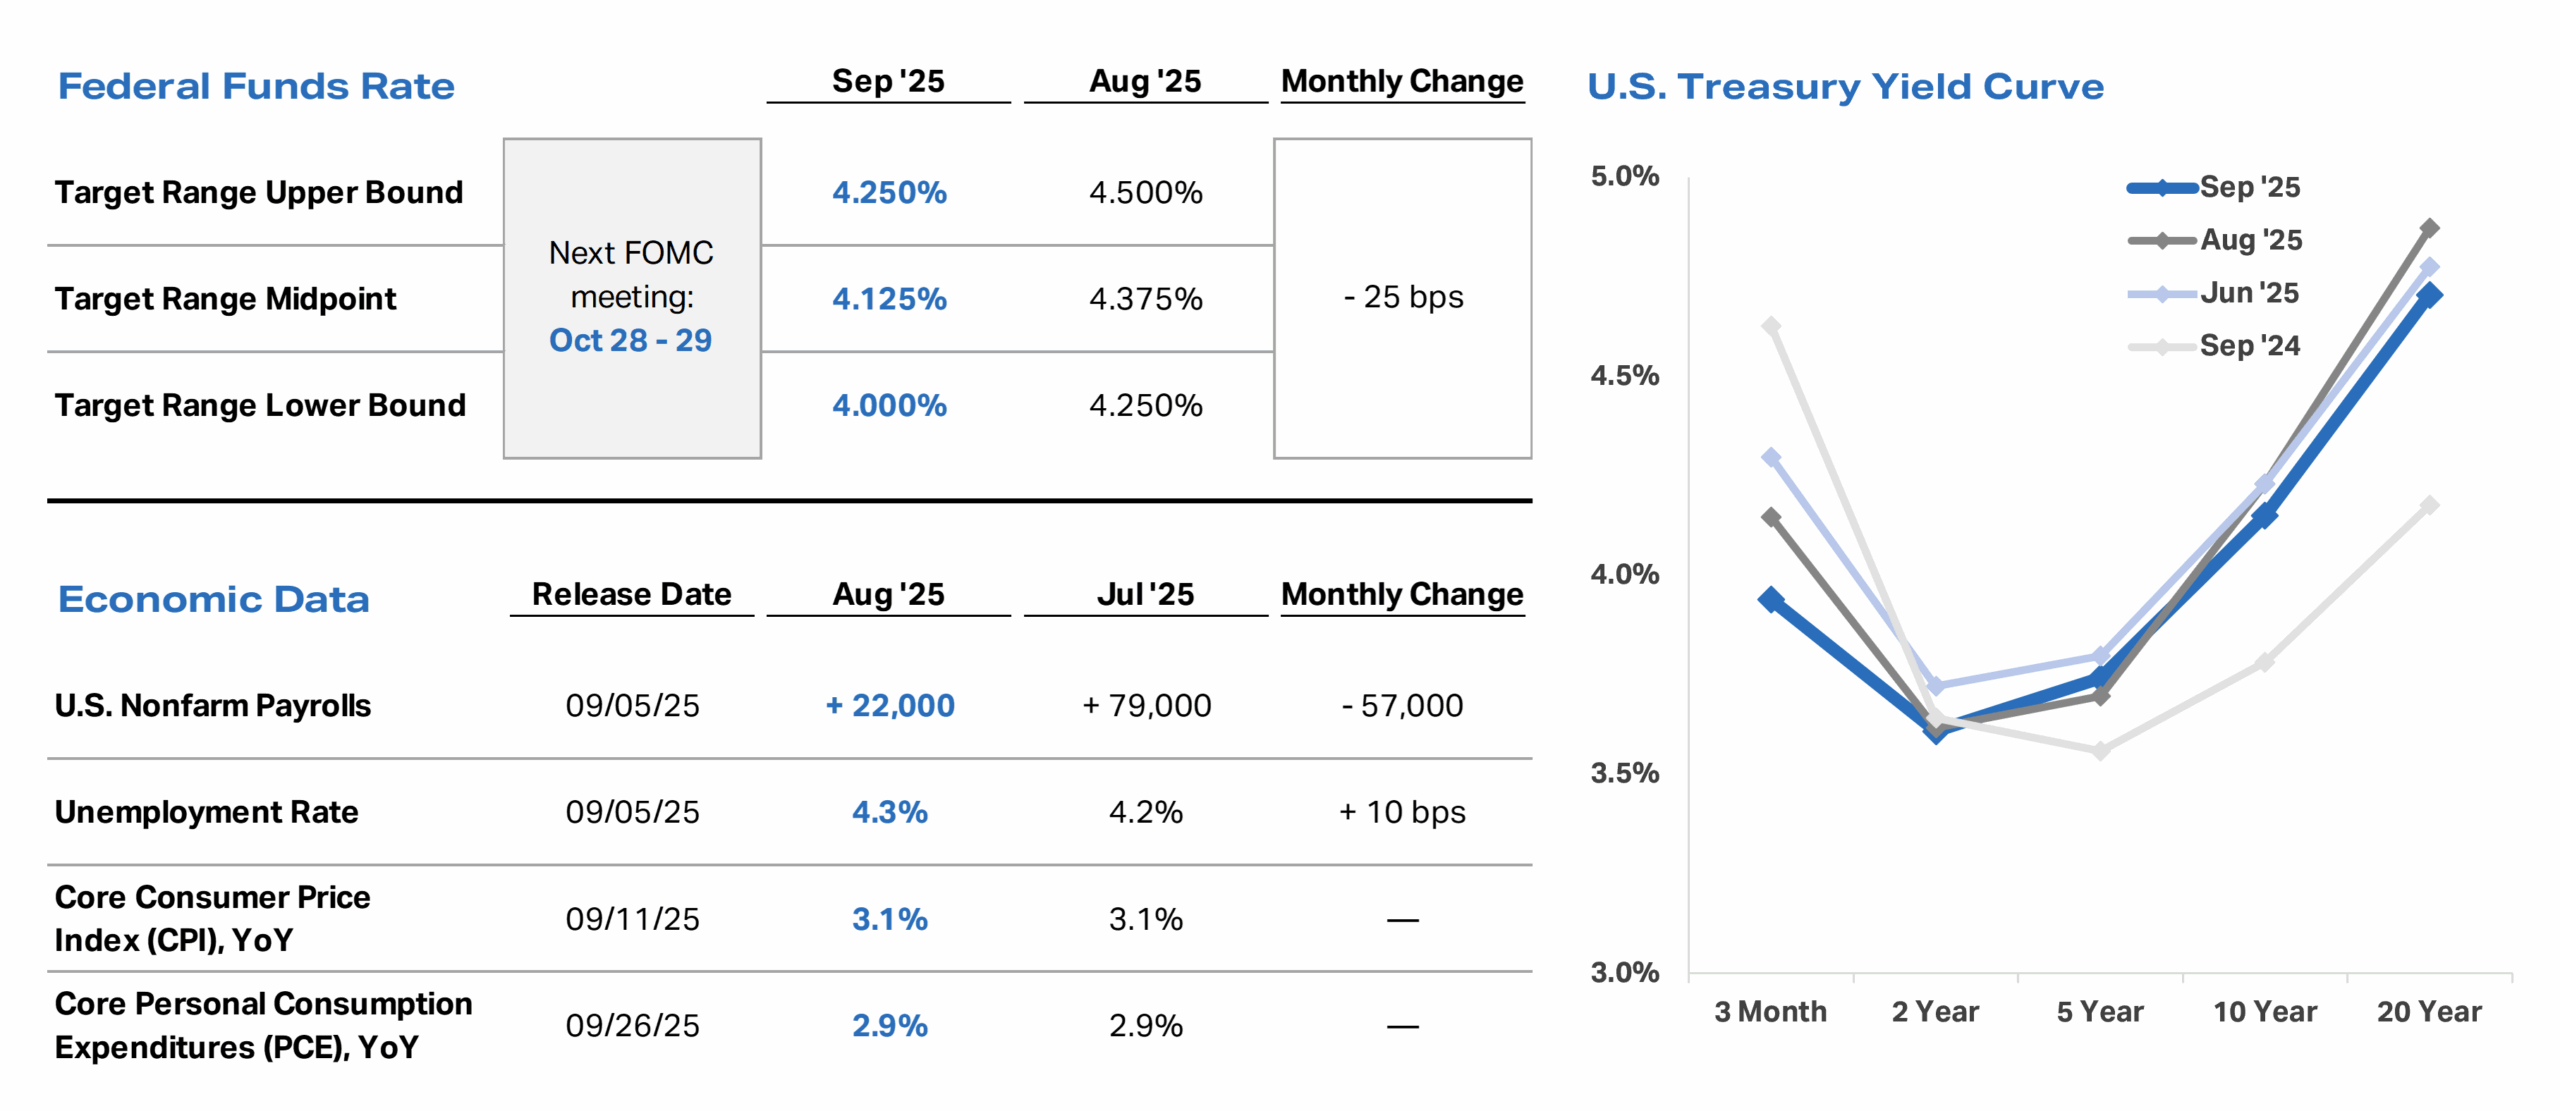
- The labor market showed further signs of softening in September as nonfarm payrolls missed consensus estimates by a wide margin and the combined June and July employment figures were revised lower. The unemployment rate also increased and, while still materially below long-term historical averages, reached its highest level since 2021.
- Core inflation measures were in line with consensus estimates and unchanged month-over-month. Although inflation continues to exceed the Fed’s long-term target, it has eased considerably from its highs in 2022.
- At its September meeting, the Fed lowered the target range for the federal funds rate by 25 basis points in its first interest rate cut since December 2024, citing rising downside risks to employment and noting the tension between its dual mandate goals. The fed funds futures market is pricing in a high likelihood of two additional quarter-point rate cuts in 2025, in line with the FOMC’s median expectations as seen in the most recent Summary of Economic Projections (SEP).
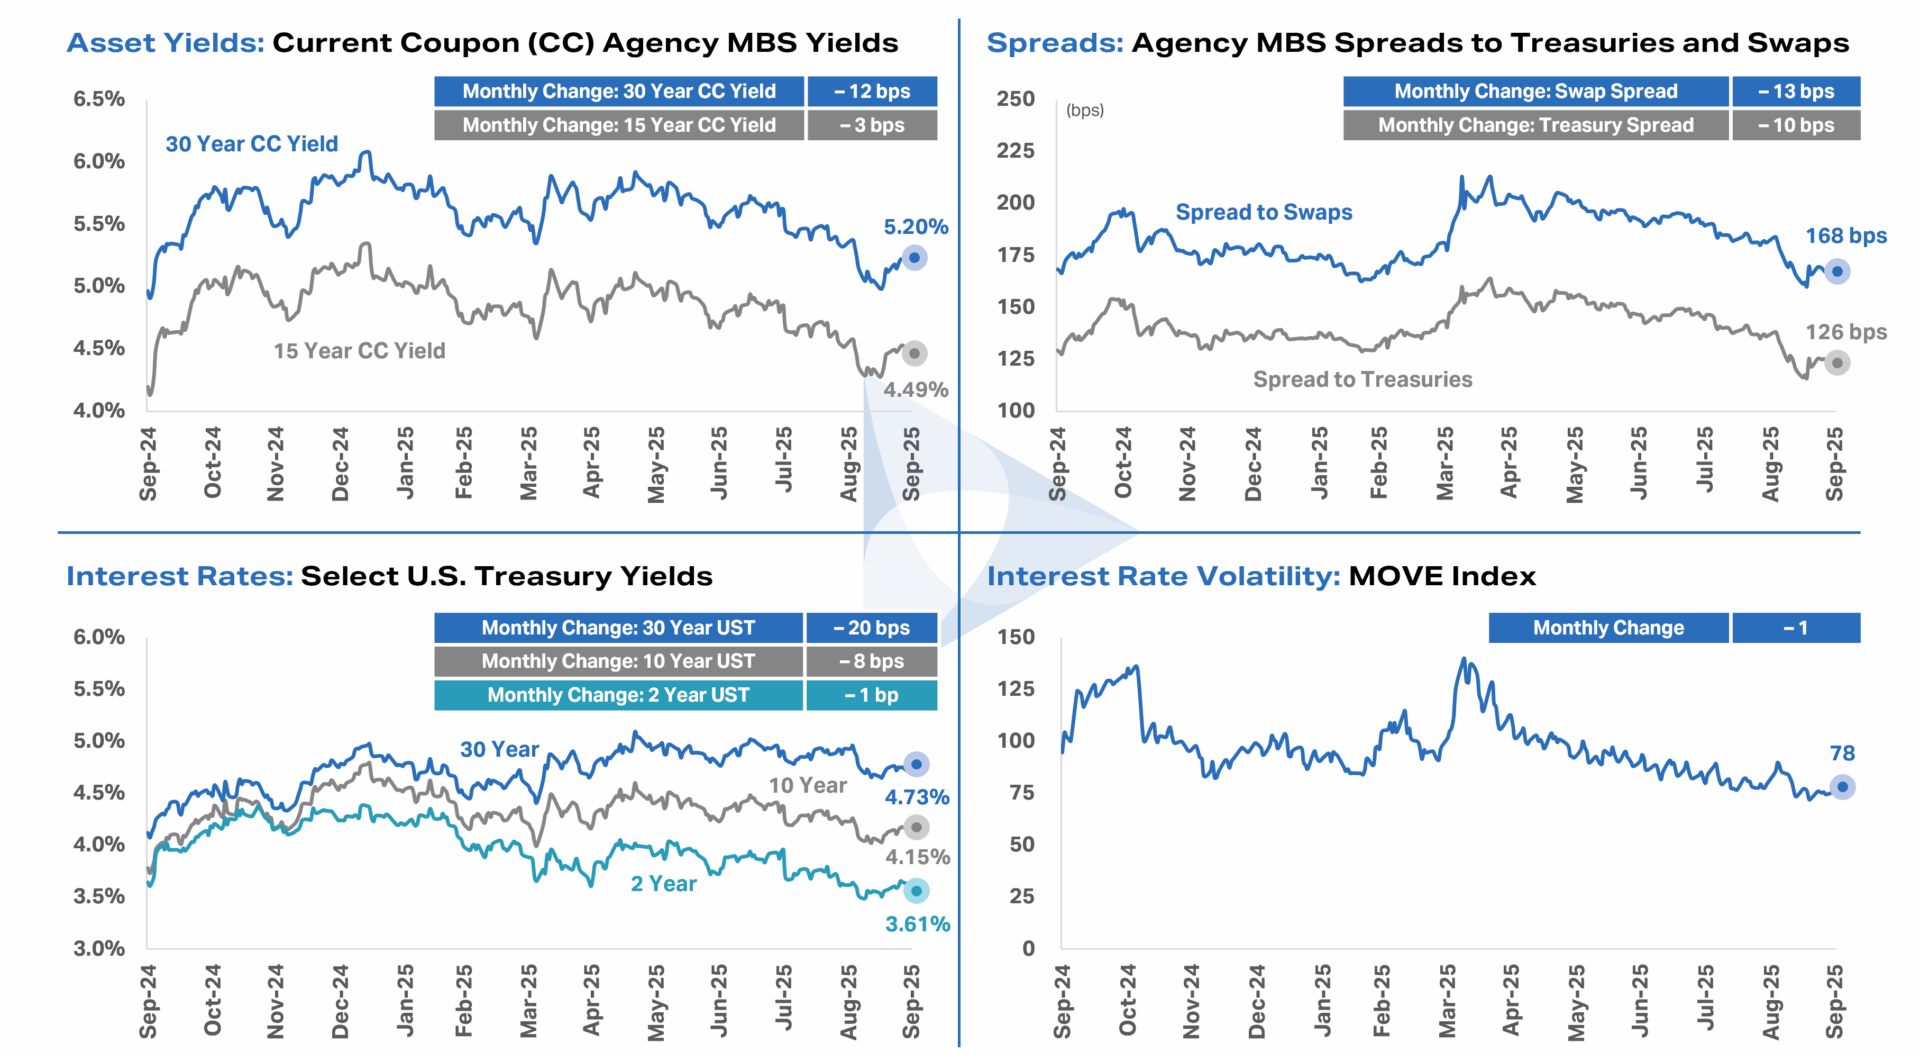
- Against the backdrop of further rate cut expectations and relatively subdued interest rate volatility, benchmark interest rates declined, and Agency MBS spreads to benchmark rates tightened during the month. Broader macroeconomic uncertainty is expected to persist over the near term, however, particularly as the U.S. government entered its first shutdown since 2019 on October 1st.
Key Rate and Spread trends
Important Disclosures
Federal funds rate data last updated September 30, 2025. Source: Federal Reserve.
Economic data last updated September 30, 2025. Core CPI and Core PCE exclude food and energy. Source: Bureau of Labor Statistics and Bureau of Economic Analysis.
U.S. Treasury yield curve reflects month-end Treasury yields for each tenor and month shown. Source: Bloomberg.
Agency MBS spread to U.S. Treasuries and Agency MBS spread to swaps reflect the 30-year current coupon Agency MBS yield spread to a 50/50 average of 5- and 10-year U.S. Treasury yields and a 50/50 average of 5- and 10-year SOFR OIS swaps, respectively. MOVE Index reflects the ICE BofA Move Index. Each chart is shown over the trailing 12 months ended September 30, 2025, and each monthly change (rounded to the nearest whole number) reflects the difference between September 2025 month-end data and August 2025 month-end data. Source: Bloomberg.
Data and commentary, including thoughts, opinions, and outlook of AGNC Investment Corp. (“AGNC”) management, are provided for information purposes only and should not be construed as investment advice.
Investment in AGNC involves risks and uncertainties that may cause future performance to vary from historical results or any forward-looking commentary provided. Please refer to our annual and quarterly reports on file with the SEC and available on our website or at www.sec.gov for more information about AGNC, including material risks, other factors that may affect future performance, and notices regarding forward-looking statements. AGNC disclaims any obligation to update or revise any forward-looking commentary. Stockholders and other interested parties may sign up to receive AGNC’s news, perspectives, and other types of email alerts by clicking the Subscribe link below.