
monthly macro monitor
key trends for the agency mbs investor
SEPTEMBER 2026
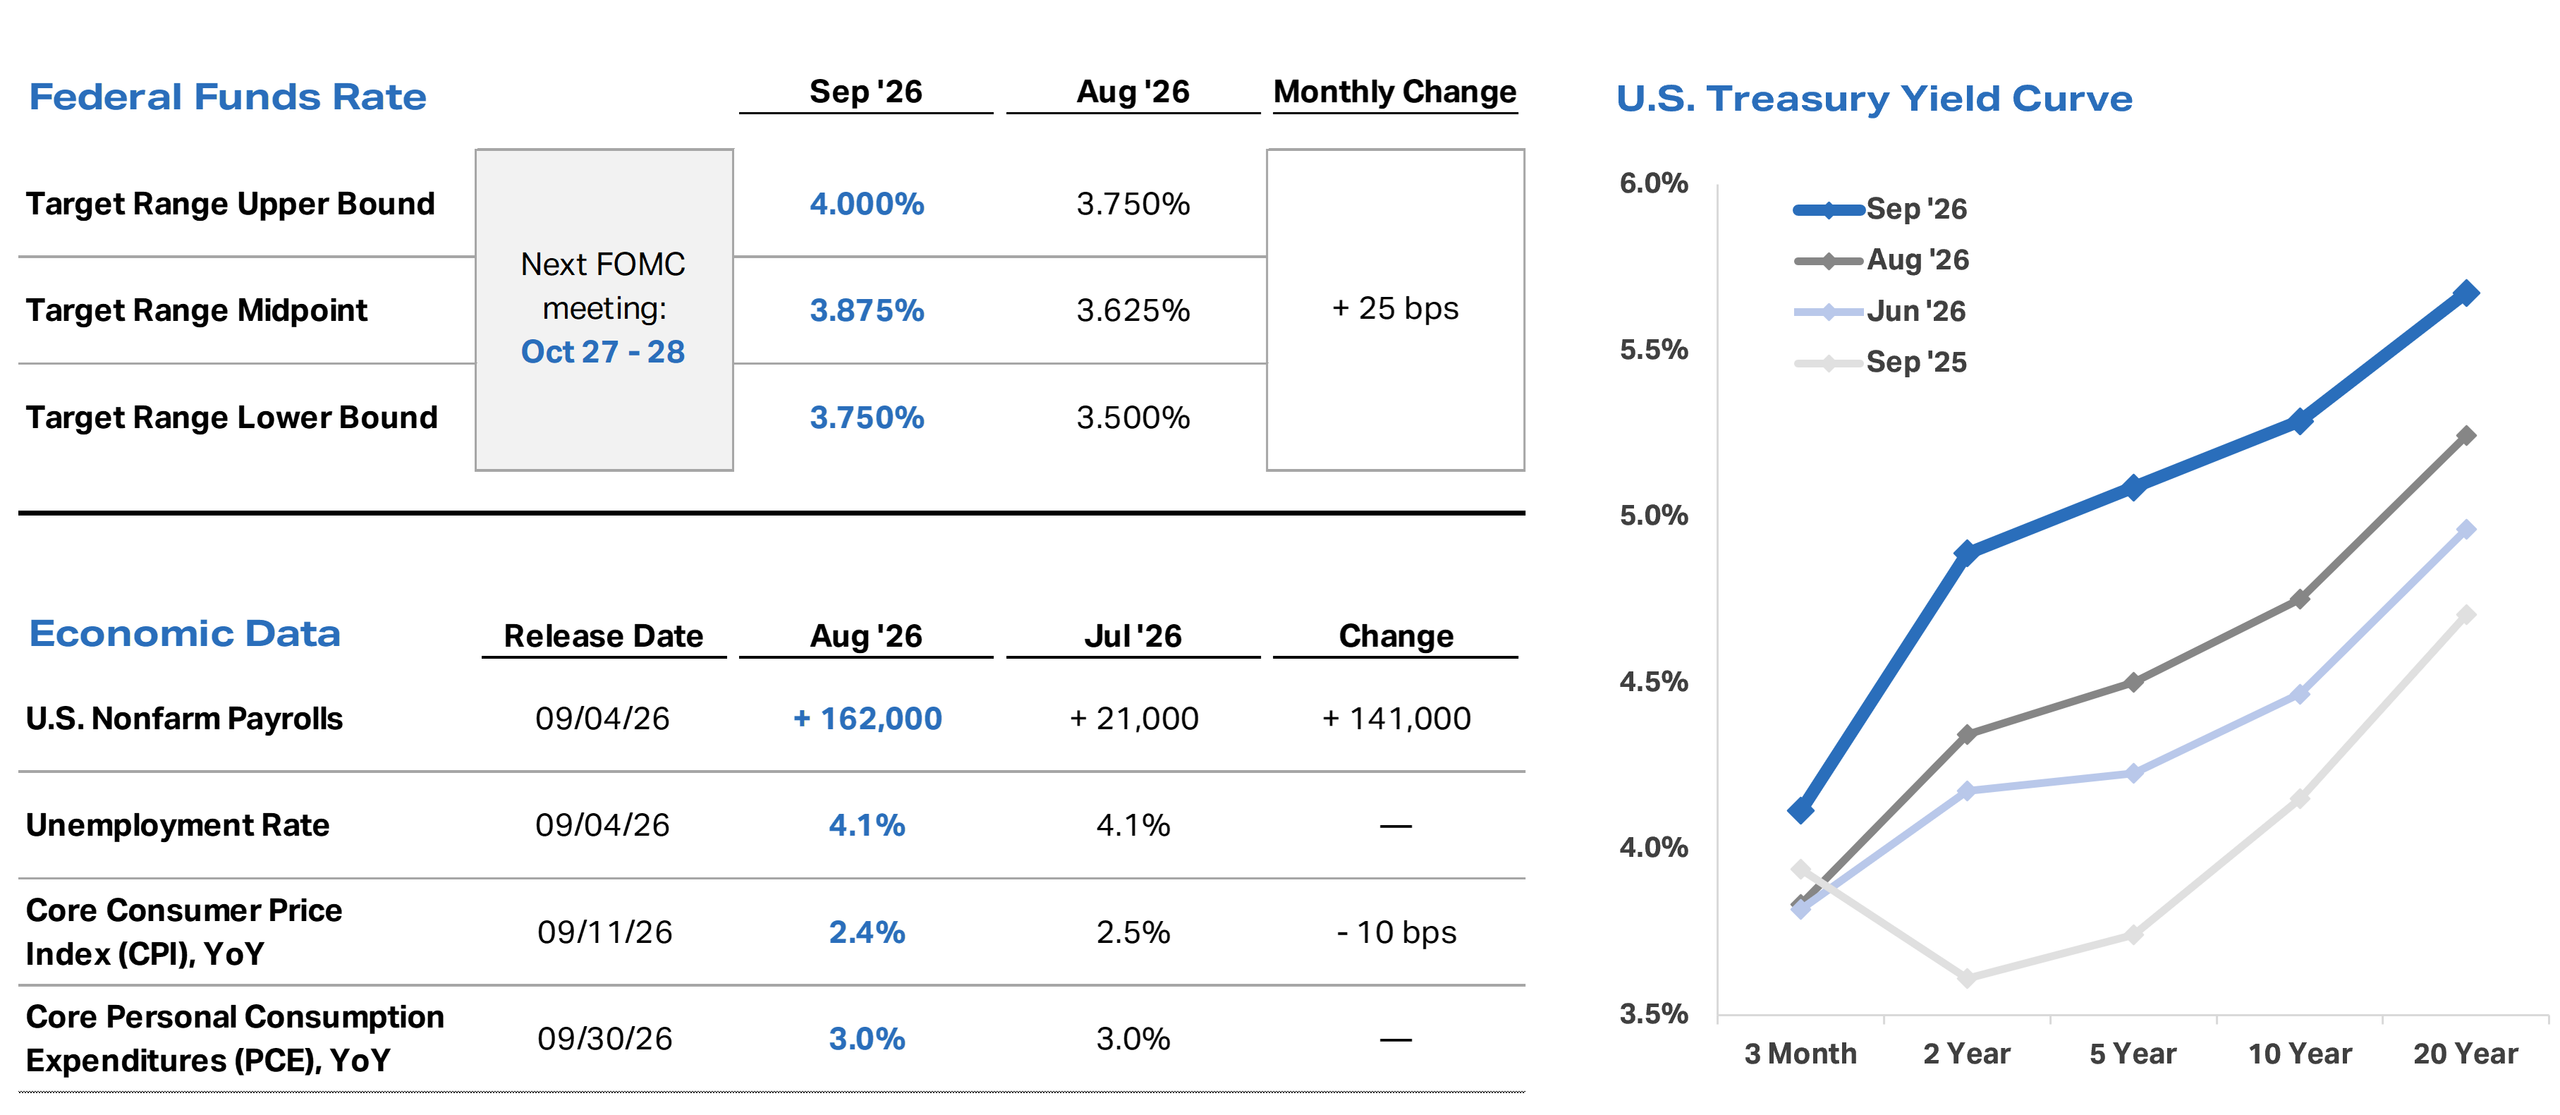
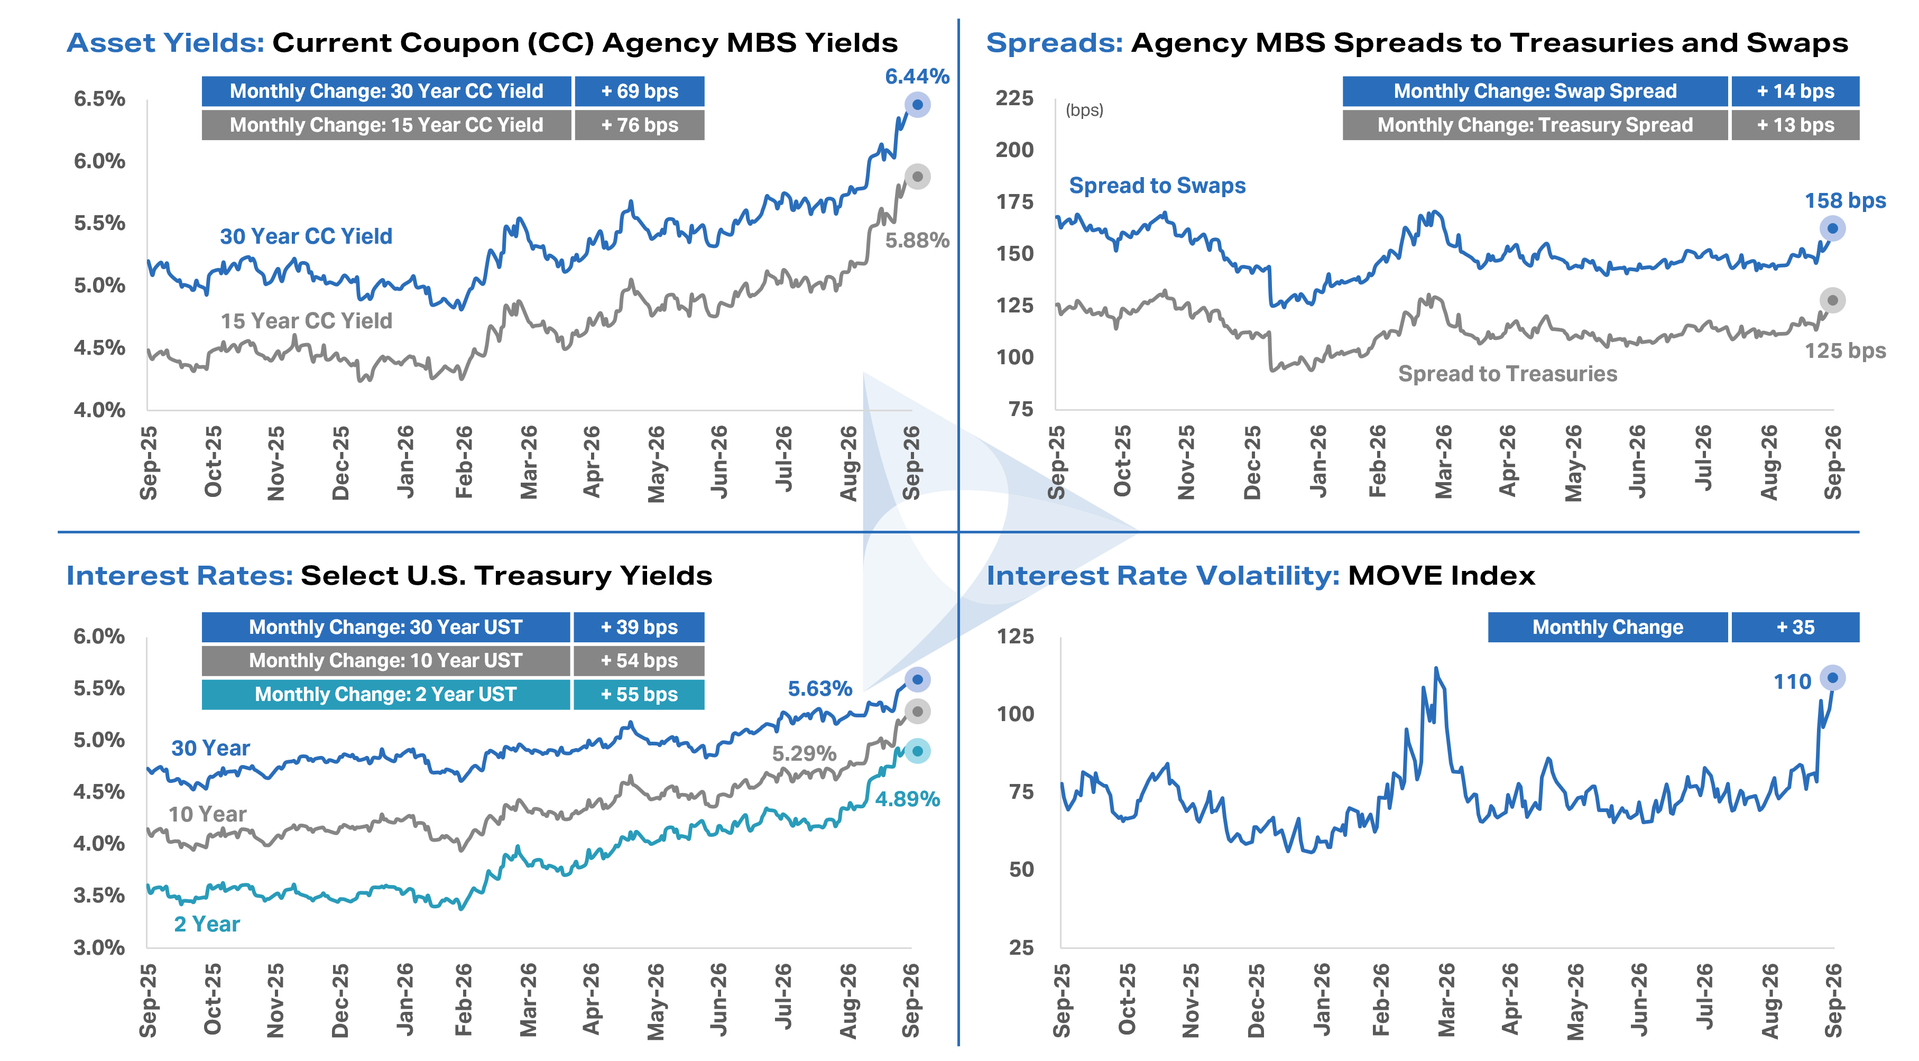
- Broad Bond Market Selloff: U.S. Treasury yields rose sharply in September as bonds sold off across the curve, with the 10-year yield climbing over 50 basis points to its highest level since 2007 and the 30-year yield reaching its highest level since 2002. The move reflected mounting fiscal and supply concerns, persistent inflationary pressures and elevated energy prices driven by the conflict in the Middle East, and the market’s reassessment of the term premium required to hold duration. The increased Treasury buyback operations for longer-dated securities, which were announced in August and took effect on September 9, provided little offset to the volatility.
- Employment: Key employment measures released in September were strong and reinforced the narrative of a solid labor market. August U.S. nonfarm payrolls (NFP) increased by 162,000, significantly surpassing estimates, and June and July totals were revised up by 55,000 in aggregate. The unemployment rate was unchanged at 4.1%, in line with estimates.
- Inflation: Despite continued pressure from elevated energy prices, key inflation measures released in September were flat to lower on a year-over-year rate basis, though they remain above the Fed’s 2% inflation objective. Specifically, core CPI eased for the third month in a row, to 2.4% from 2.5% (in line with estimates), and core PCE of 3.0% was unchanged and came in below estimates. In addition, July core PCE, originally reported at 3.3%, was revised down to 3.0% following the implementation of methodology changes by the Bureau of Economic Analysis.
- Federal Reserve and Monetary Policy: The FOMC voted unanimously to raise the target range for the federal funds rate by 25 basis points to 3.75-4.00% at its September meeting, marking the Fed’s first interest rate hike since July 2023. The Fed’s September Summary of Economic Projections (SEP) indicated that two thirds of Fed officials forecast one additional rate hike this year to 4.00-4.25%, an expectation that is now priced into fed funds futures. During his press conference, Chairman Warsh emphasized that “inflation is too high and has been for too long” and that the Fed “removed a dose of accommodation,” as the economy appears to be strengthening against a prolonged backdrop of persistent inflation and geopolitical uncertainty. Read our September Fed Report for more details.
- Interest Rates and Agency MBS Spreads: The broad bond market selloff drove interest rates meaningfully higher across the curve and a significant increase in interest rate volatility, as the MOVE Index reached its highest level since the onset of the Iran conflict in March 2026. The weakness across the fixed income market caused Agency MBS spreads to benchmark rates to widen month-over-month.
Key Economic Data and Yield Curve Trends
Key Rate and Spread trends
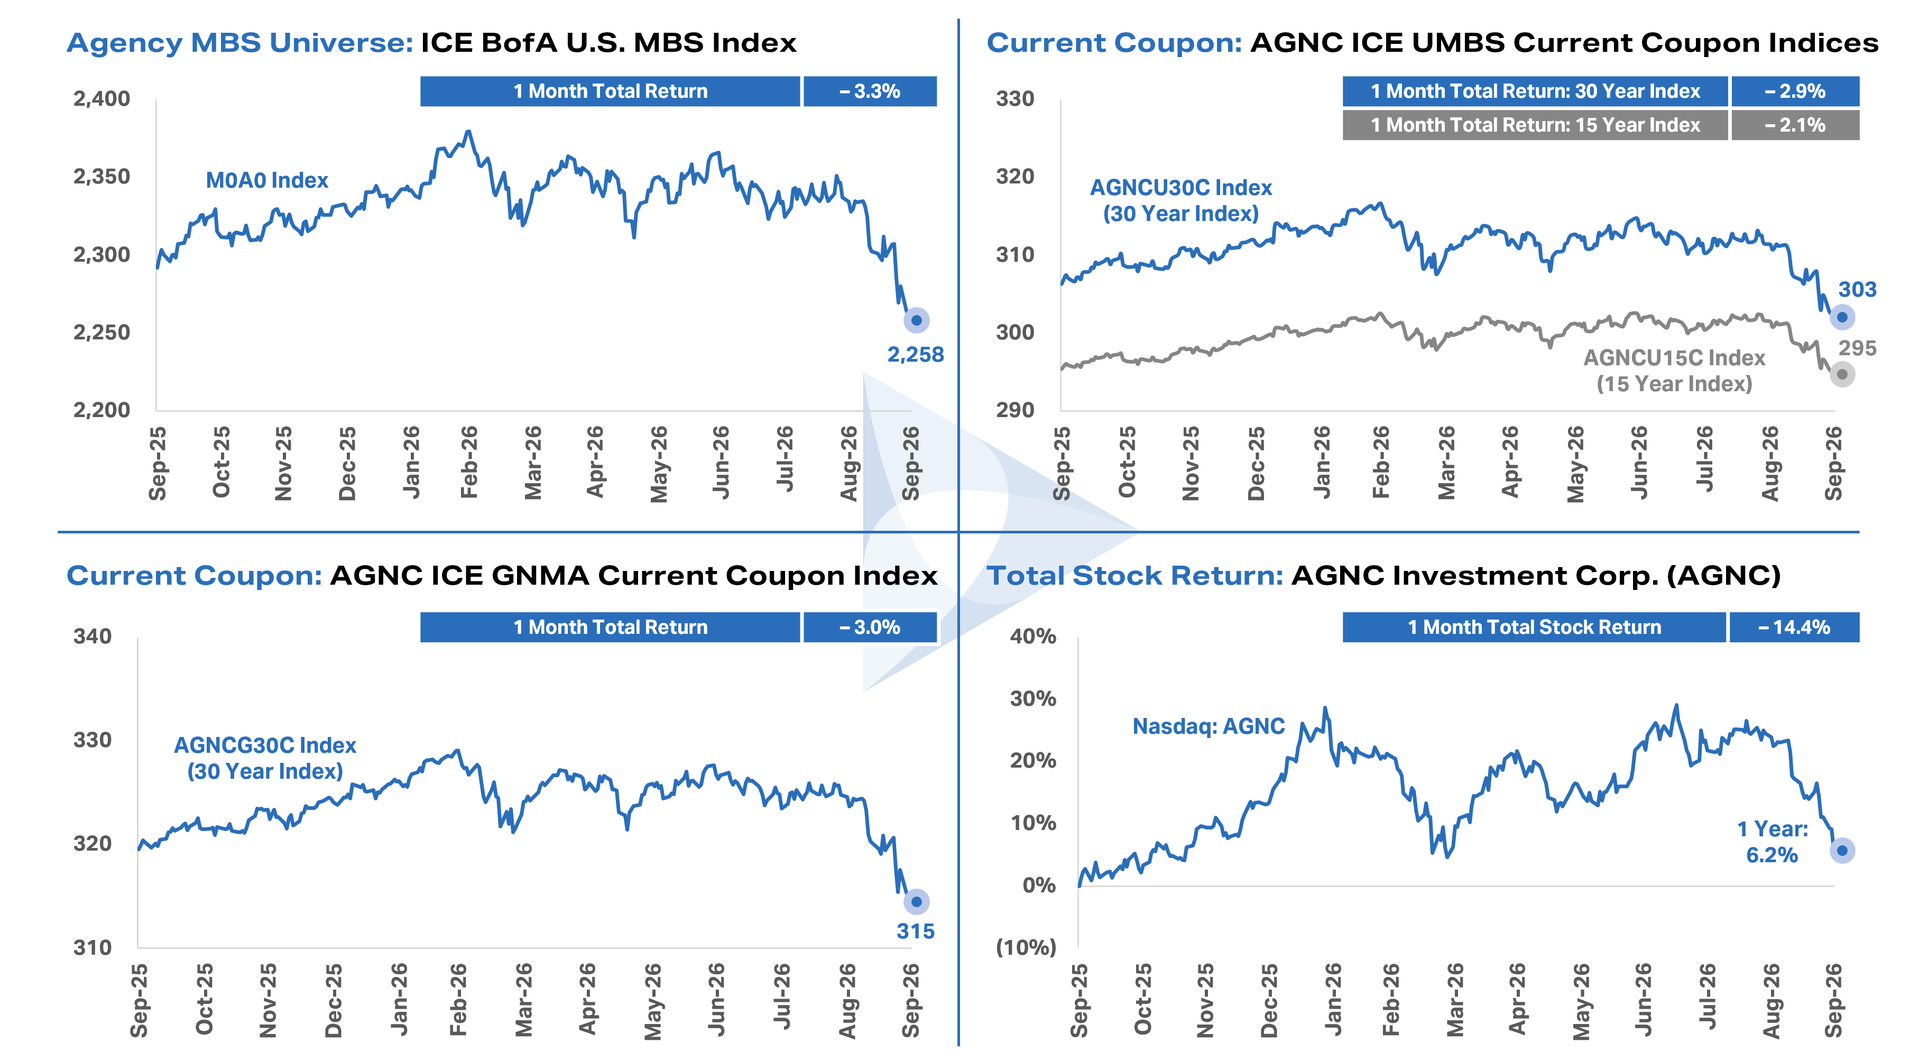
mortgage performance
Important Notices and Disclosures
Data and commentary, including thoughts, opinions, and outlook of AGNC Investment Corp. (“AGNC”) management, are provided for information purposes only and should not be construed as investment advice.
Federal funds rate data last updated September 30, 2026. Source: Federal Reserve.
Economic data last updated September 30, 2026. Core CPI and core PCE exclude food and energy. Source: Bureau of Labor Statistics and Bureau of Economic Analysis.
U.S. Treasury yield curve reflects month-end Treasury yields for each tenor and month shown. Source: Bloomberg.
Agency MBS spread to U.S. Treasuries and Agency MBS spread to swaps reflect the 30-year current coupon Agency MBS yield spread to a 50/50 average of 5- and 10-year U.S. Treasury yields and a 50/50 average of 5- and 10-year SOFR OIS swaps, respectively. MOVE Index reflects the ICE BofA Move Index. Each chart is shown over the trailing 12 months ended September 30, 2026, and each monthly change (rounded to the nearest whole number) reflects the difference between September 2026 month-end data and August 2026 month-end data. Source: Bloomberg.
The ICE BofA U.S. Mortgage Backed Securities Index (M0A0) is shown over the trailing 12 months ended September 30, 2026, and the total return is measured over the one month ended September 30, 2026. Source: Bloomberg.
The AGNC ICE UMBS 30-Year Current Coupon Index (AGNCU30C) and the AGNC ICE UMBS 15-Year Current Coupon Index (AGNCU15C) track the performance of 30-year and 15-year, respectively, fixed rate residential mortgage pass-through securities issued under the Uniform Mortgage-Backed Security (UMBS) program guaranteed by Fannie Mae and Freddie Mac. The AGNC ICE GNMA 30-Year Current Coupon Index (AGNCG30C) tracks the performance of U.S. dollar denominated 30-year fixed rate residential mortgage pass-through securities publicly issued by Ginnie Mae (GNMA) in the U.S. domestic market. Each chart is shown over the trailing 12 months ended September 30, 2026, and each total return is measured over the one month ended September 30, 2026. Source: Bloomberg.
ICE Data Indices, LLC (“ICE Data”) is the Administrator and the calculation agent for the AGNC ICE UMBS 30-Year Current Coupon Index, the AGNC ICE UMBS 15-Year Current Coupon Index, and the AGNC ICE GNMA 30-Year Current Coupon Index (collectively, the “Indices”). Additional information regarding the Indices is available at indices.ice.com. You may not download, use, share, disclose, transmit, publish, distribute, disseminate, scrape, or commercialize the Indices data contained herein. ICE DATA AND ITS THIRD PARTY SUPPLIERS MAKE NO EXPRESS OR IMPLIED WARRANTIES, AND HEREBY EXPRESSLY DISCLAIM ALL WARRANTIES OF MERCHANTABILITY OR FITNESS FOR A PARTICULAR PURPOSE WITH RESPECT TO THE INDICES, INDICES VALUES OR ANY DATA INCLUDED THEREIN AS WELL AS WITH RESPECT TO THE CALCULATION AND DISSEMINATION OF SUCH INDICES. IN NO EVENT SHALL ICE DATA AND ITS THIRD PARTY SUPPLIERS HAVE ANY LIABILITY FOR ANY SPECIAL, PUNITIVE, DIRECT, INDIRECT, OR CONSEQUENTIAL DAMAGES (INCLUDING LOST PROFITS), EVEN IF NOTIFIED OF THE POSSIBILITY OF SUCH DAMAGES.
The indices cited herein are provided for information purposes only. To the extent the index provides a general investment strategy, it does not take into account any specific needs or financial circumstances of any person, entity or group of persons or entities and should not be considered investment advice or a recommendation to buy or sell securities. Past performance of the index is not indicative of future performance. Actual ongoing or future performance will vary, perhaps materially, from the performance provided herein. The performance of each index does not include fees or costs of any financial instrument that references the index. Index levels for periods before the index’s live date represent hypothetical data determined by retroactive application of a back-tested model, itself designed with the benefit of hindsight. Index information, data and values included herein are provided on an “as is where is” basis and are subject to the disclaimers and other important disclosures included in ICE’s Bond Index Methodologies available here or on ICE’s website. AGNC makes no representation or warranty, express or implied, with respect to the indices, any index value or data included therein, including any warranty of merchantability or fitness for a particular purpose, and any and all representations and warranties are hereby disclaimed. For additional important information, disclosures, pool cohort construction, and index methodologies, please refer to the following links: AGNCU30C, AGNCU15C, and AGNCG30C.
AGNC total stock return is measured over the trailing one and 12 months ended September 30, 2026; it includes price appreciation and dividend reinvestment, and dividends are assumed to be reinvested at the closing price of the security on the ex-dividend date. Past performance is not indicative of future results. Source: Bloomberg.
Investment in AGNC involves risks and uncertainties that may cause future performance to vary from historical results or any forward-looking commentary provided. Please refer to our annual and quarterly reports on file with the SEC and available on our website or at www.sec.gov for more information about AGNC, including material risks, other factors that may affect future performance, and notices regarding forward-looking statements. AGNC disclaims any obligation to update or revise any forward-looking commentary. Stockholders and other interested parties may sign up to receive AGNC’s news, perspectives, and other types of email alerts by clicking the Subscribe link.