

THE EARNINGS Extract
Q2 2026 EARNINGS COMMENTARy
JULY 21, 2026
The investment environment in the second quarter continued to be challenging, as escalating rhetoric and hostilities between the United States and Iran largely dictated financial market performance. Elevated energy prices and supply chain disruptions were the dominant macroeconomic concerns, particularly in April and May when maritime traffic through the Strait of Hormuz was severely constrained. These concerns caused Treasury yields to increase, the yield curve to flatten, and the market’s monetary policy expectations to pivot from rate cuts to rate hikes.
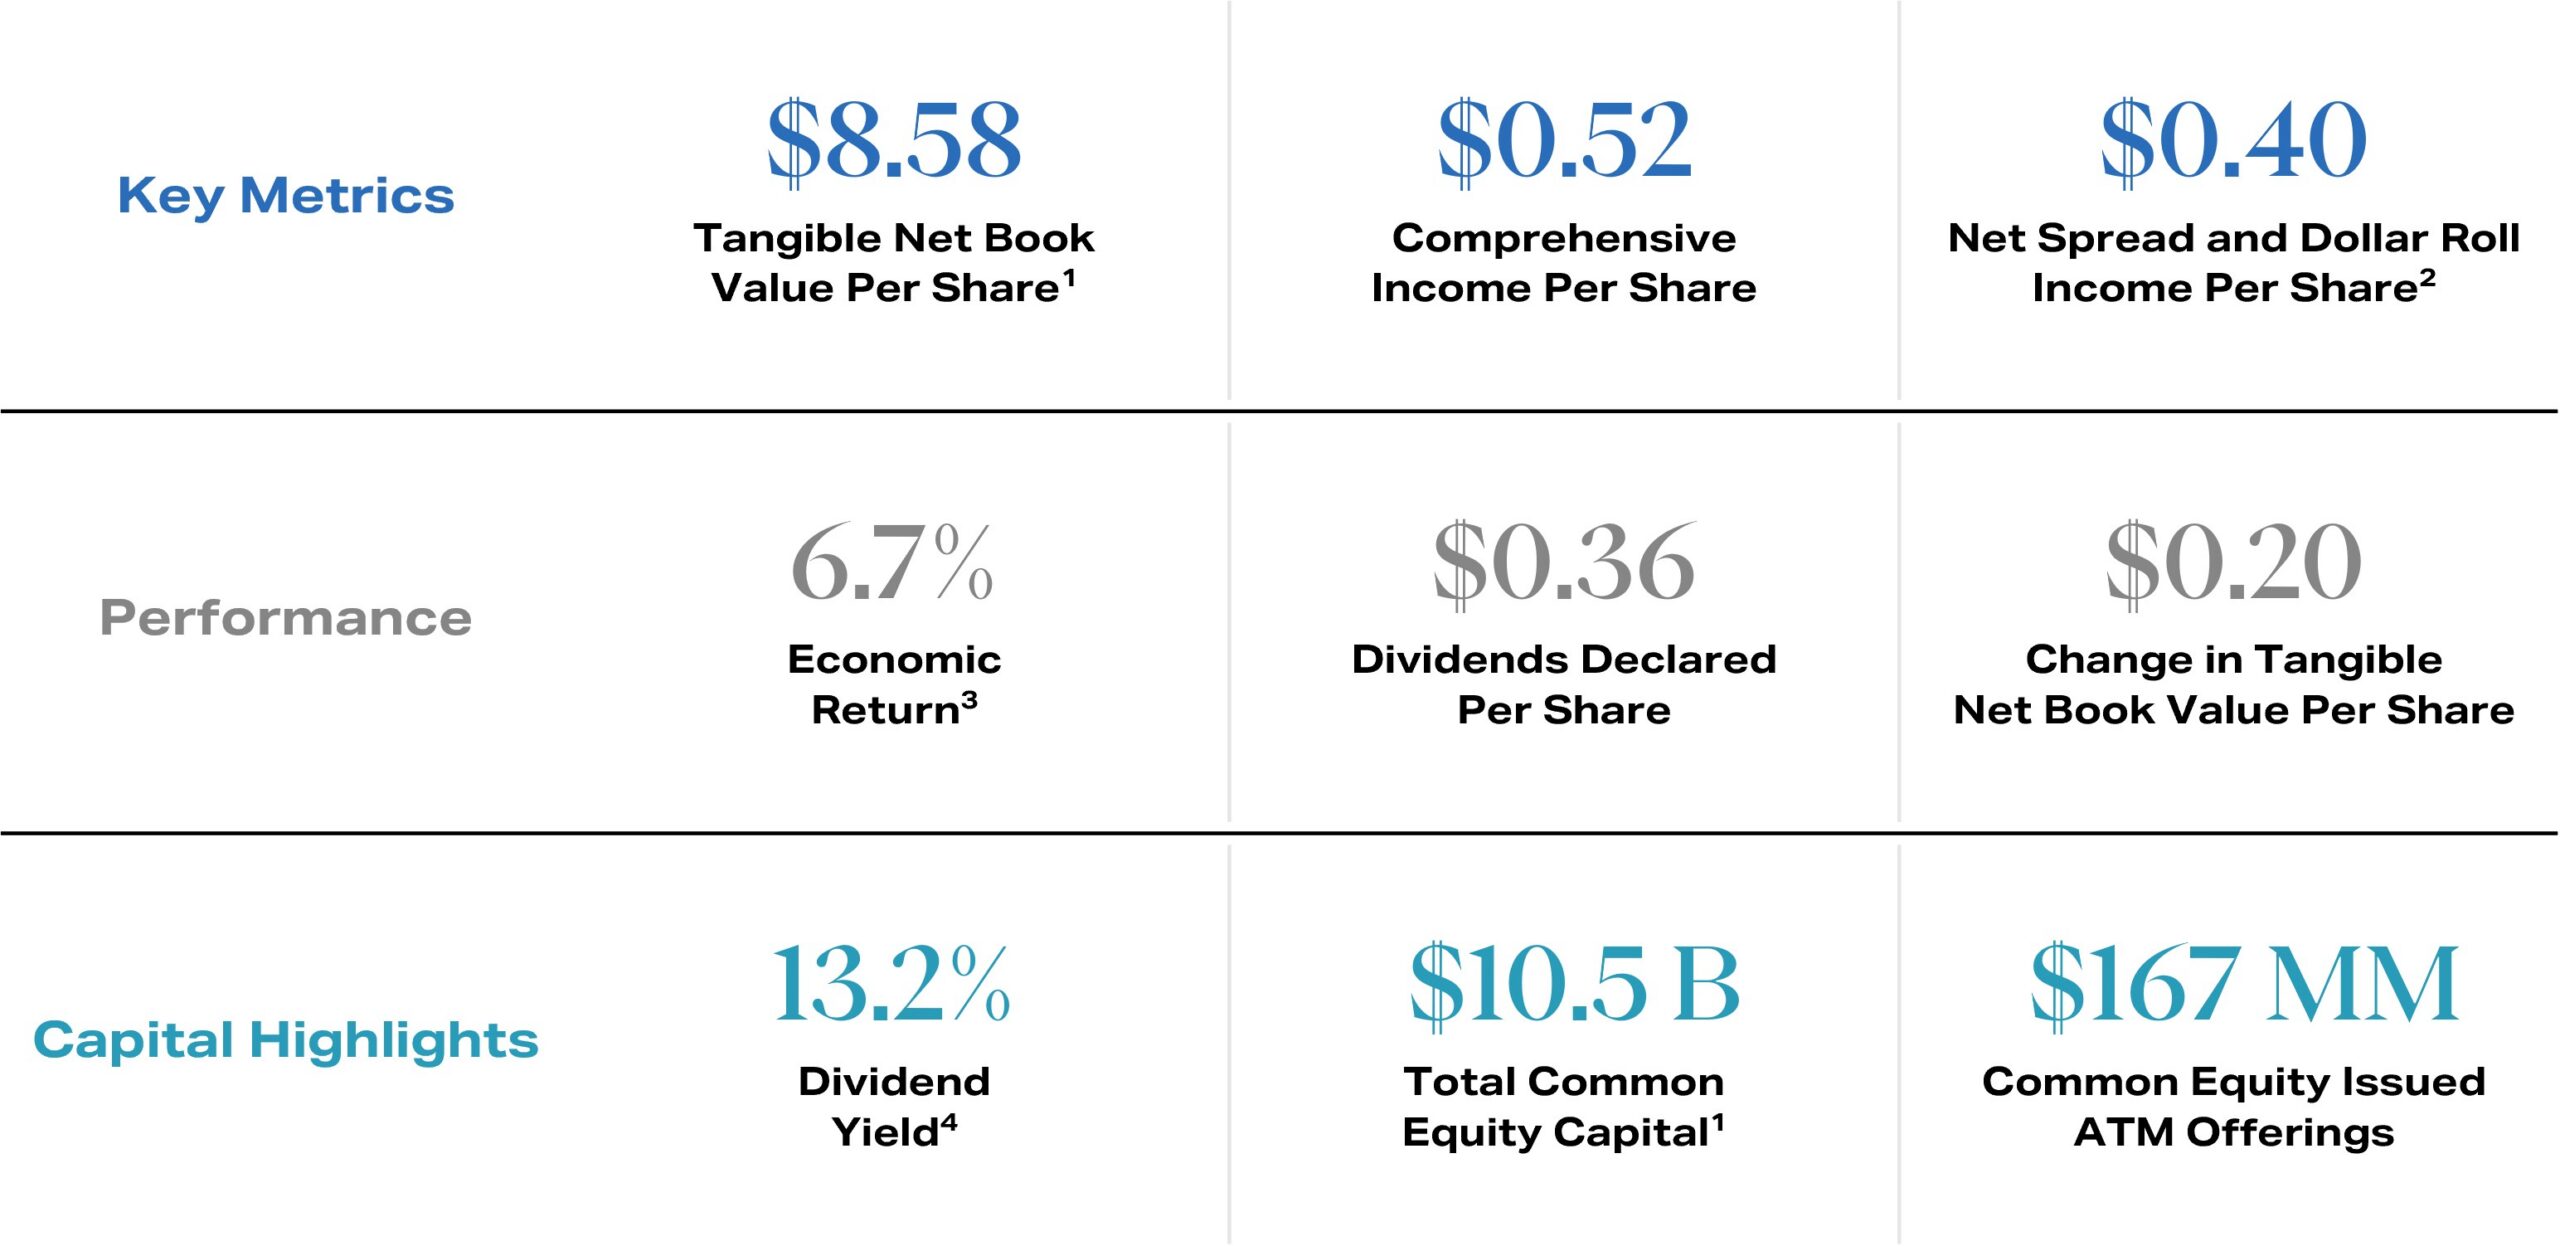
Despite the volatile macroeconomic backdrop, AGNC delivered a strong economic return of 6.7% for the second quarter. Elevated mortgage rates caused a reduction in projected Agency MBS supply, while demand remained strong, creating a positive technical backdrop that supported Agency MBS performance and drove spreads to benchmark rates tighter. Although mortgage spreads have declined from recent peak levels, they remain elevated by historical standards. Agency MBS also offer compelling value relative to other fixed income alternatives, particularly corporate bonds, which are at or near historically tight spreads to U.S. Treasuries despite record issuance and rising credit concerns. Together, these favorable dynamics should be supportive of Agency MBS performance over the near to intermediate term and position AGNC to continue to deliver strong risk-adjusted returns for our stockholders.
Q2 2026 Highlights
management commentary highlights
Macroeconomic and Agency MBS Market Environment
Peter Federico | President, Chief Executive Officer, and Chief Investment Officer
The investment environment in the second quarter continued to be challenging, as escalating rhetoric and hostilities between the United States and Iran largely dictated financial market performance. With ship traffic through the Strait of Hormuz severely constrained, elevated energy prices and supply chain disruptions were the dominant macroeconomic concerns during the quarter. These concerns caused Treasury yields to increase, the yield curve to flatten, and the market’s outlook for monetary policy to pivot from rate cuts to rate hikes by year-end.
Despite the elevated geopolitical and macroeconomic uncertainty, and the bearish shift in fixed income sentiment during the quarter, AGNC generated a strong economic return of 6.7%, comprised of our attractive monthly dividend and improvement in our tangible book value per common share. Also notable, the monthly common stock dividend that we paid at the beginning of July marked the 75th consecutive monthly dividend payment of $0.12 per common share, a track record of performance that we believe illustrates the value of AGNC’s disciplined approach to risk management and portfolio construction over a wide range of investment environments.
The improvement in our tangible net book value per share was driven by the solid performance of Agency MBS, which generated a positive excess return to U.S. Treasuries for the fifth consecutive quarter. This five-quarter track record of outperformance is unusual, and particularly noteworthy, given the similar credit quality of these two asset classes.
The catalyst for the favorable performance of Agency MBS was improving technical factors. With the primary mortgage rate continuing to be above 6.5%, the net new supply of Agency MBS this year will likely drop to about $150 billion, materially lower than the supply estimates at the beginning of the year. Elevated mortgage rates have also caused prepayment speeds to slow. As a result, Agency MBS runoff from the Fed’s portfolio will be lower than expected this year.
Against the backdrop of falling supply, the demand for Agency MBS has remained strong. Through the first six months of the year, bond fund inflows have totaled more than $400 billion and are running about double the pace of last year. A significant portion of these inflows get invested in Agency MBS and are an important source of demand. Banks, foreign investors, and REITs should also all continue to be net purchasers of Agency MBS over the remainder of the year. Lastly, with the outlook for private credit deteriorating and equity valuations stretched by many measures, the demand for high quality fixed income assets should remain strong or perhaps even increase over the near term. We expect these favorable supply and demand dynamics to become more apparent over time and to benefit Agency MBS performance in the second half of the year.
Another important consideration that shapes the outlook for Agency MBS is the compelling value that this asset class offers relative to corporate bonds. In the second quarter, corporate bonds were the best performing fixed income sector by a wide margin, significantly outperforming both U.S. Treasuries and Agency MBS. The Bloomberg U.S. Investment Grade Corporate Index and the Bloomberg U.S. High Yield Index ended the second quarter at spreads to U.S. Treasuries of 75 and 290 basis points, respectively, levels that were among the lowest on record. Surprisingly, these historically tight spread levels come at a time when corporate issuance this year is expected to exceed $1.1 trillion, making 2026 the largest corporate debt issuance year ever.
In light of the improved technical backdrop, and despite elevated geopolitical risk, our outlook for Agency MBS remains encouraging. Agency MBS spreads have moved little this year and continue to be wide by historical standards, despite supply being lower than expected and demand being greater than expected. Corporate spreads, on the other hand, have narrowed through the first half of the year and are tight by historical standards, despite record issuance and rising credit concerns. Once the current elevated level of geopolitical and monetary policy uncertainty subsides, we believe these constructive dynamics will become more apparent, and over time, drive favorable Agency MBS performance. Moreover, we believe AGNC is well-positioned to continue to deliver strong risk-adjusted returns for our stockholders in this environment.
Our Quarterly Financial Results
Bernie Bell | EVP and Chief Financial Officer
For the second quarter of 2026, AGNC reported comprehensive income of $0.52 per common share. Our economic return on tangible common equity was 6.7% for the quarter, consisting of $0.36 of dividends declared per common share and a $0.20 increase in tangible net book value per common share due to mortgage outperformance relative to our interest rate hedges. Our total stock return for the quarter was even more favorable at 12.3% with dividends reinvested, which brings our one-year total stock return to 36.1% with dividends reinvested. As of late last week, our tangible net book value per common share was down approximately 1%, or a little less than 2% net of our monthly dividend accrual for July.
Both ending and average leverage were unchanged at 7.4x tangible equity for the quarter, and we ended the period with $7.5 billion of unencumbered cash and Agency MBS, representing 62% of tangible equity. Net spread and dollar roll income totaled $0.40 per common share for the quarter, down $0.02 from the first quarter. The decrease primarily reflects a six basis point decline in our net interest spread, driven by lower asset yields from portfolio repositioning, partly offset by modestly lower funding costs. The average projected life CPR of our portfolio decreased by 170 basis points to 8.6% at quarter-end due to coupon and TBA versus specified pool repositioning. Actual CPRs were largely unchanged at 13% for the quarter.
Lastly, during the second quarter, we continued to actively manage our capital for the benefit of existing stockholders, issuing $167 million of common equity through our at-the-market offering program at a significant premium to tangible net book value per share while maintaining a disciplined and opportunistic approach to capital issuance.
Portfolio Update and Additional Commentary
Peter Federico | President, Chief Executive Officer, and Chief Investment Officer
In aggregate in the second quarter, Agency MBS outperformed both Treasury and swap-based hedges, but the magnitude of outperformance did vary considerably by coupon. Higher coupon and production coupon Agency MBS experienced the greatest outperformance, as the increase in interest rates curtailed both supply and prepayment concerns. The outperformance of higher coupons relative to lower coupons was also a reversal of the coupon performance in the first quarter. With swap spreads widening in the second quarter, Agency MBS hedged with swaps also performed better than Agency MBS hedged with Treasury securities. At quarter-end, the spread differential between a current coupon Agency MBS and a blend of hedges across the swap curve was about 145 basis points. At this spread level, Agency MBS are trading near the middle of our expected range of approximately 120 to 160 basis points.
At quarter-end, the market value of our asset portfolio totaled $97.2 billion. During the quarter, we purchased $2.2 billion of primarily intermediate coupon specified pools. Early in the quarter, we also sold some lower coupon Agency MBS and bought higher coupon Agency MBS to lock in gains from the strong performance of low coupons in the first quarter and capture the yield benefit associated with higher coupons given expectations for a more benign prepayment environment. As a result, the weighted average coupon on our portfolio increased to 5.04%. The percentage of assets with favorable prepayment characteristics also increased slightly to 79%.
The notional balance of our hedge portfolio totaled $65.5 billion at quarter-end, up slightly from the prior quarter due to the addition of intermediate and longer-term Treasury-based hedges. With the maturity of approximately $3 billion of swap hedges, and the additional Treasury hedges, our overall portfolio allocation of swap-based hedges declined to 66% at quarter-end on a duration dollar basis.
Lastly, we ended the quarter with a duration gap of 0.7 years, unchanged from the prior quarter. We continue to favor operating with a positive duration gap given the current level of interest rates, the convexity profile of our portfolio, and the expected correlation between mortgage spreads and interest rates.
Important Disclosures
This commentary includes excerpts from AGNC Investment Corp.’s (“AGNC”) Q2 2026 earnings call. Click here to listen to the full webcast and access the earnings release and presentation.
Per share amounts are per share of common stock, unless otherwise indicated. Income and loss per share amounts are per diluted common share, unless otherwise indicated.
1. As of June 30, 2026. Tangible Net Book Value Per Share and Total Common Equity Capital are net of the preferred stock liquidation preference. Tangible Net Book Value Per Share excludes goodwill.
2. Net Spread and Dollar Roll Income Per Share represents a non-GAAP measure. Refer to our Q2 2026 Stockholder Presentation for a reconciliation and further discussion of non-GAAP measures.
3. Economic Return represents the sum of the change in tangible net book value per common share and dividends declared on common stock during the period over the beginning tangible net book value per common share.
4. Dividend Yield as of June 30, 2026.
These materials contain forward-looking statements within the meaning of the Private Securities Litigation Reform Act. Forward-looking statements are based on estimates, projections, beliefs and assumptions of management of AGNC at the time of such statements and are not guarantees of future performance. Forward-looking statements involve risks and uncertainties in predicting future results and conditions. Actual results could differ materially from those projected in these forward-looking statements or from our historic performance due to a variety of important factors, including, without limitation, changes in monetary policy and other factors that affect interest rates, MBS spreads to benchmark interest rates, the forward yield curve, or prepayment rates; the availability and terms of financing; changes in the market value of AGNC’s assets; general economic or geopolitical conditions; liquidity and other conditions in the market for Agency securities and other financial markets; and legislative and regulatory changes that could adversely affect the business of AGNC. Certain factors that could cause actual results to differ materially from those contained in the forward-looking statements are included in AGNC’s periodic reports filed with the SEC and available on the SEC’s website at www.sec.gov. AGNC disclaims any obligation to update or revise any forward-looking statements based on the occurrence of future events, the receipt of new information, or otherwise.
We use our website (www.AGNC.com) and AGNC’s LinkedIn and X accounts to distribute information about the Company. Investors should monitor these channels in addition to our press releases, SEC filings, and public conference calls and webcasts, as information posted through them may be deemed material. Stockholders and other interested parties may sign up to receive AGNC’s news, perspectives, and other types of email alerts by clicking the Subscribe link.