

THE EARNINGS Extract
Q3 2026 EARNINGS COMMENTARy
October 20, 2026
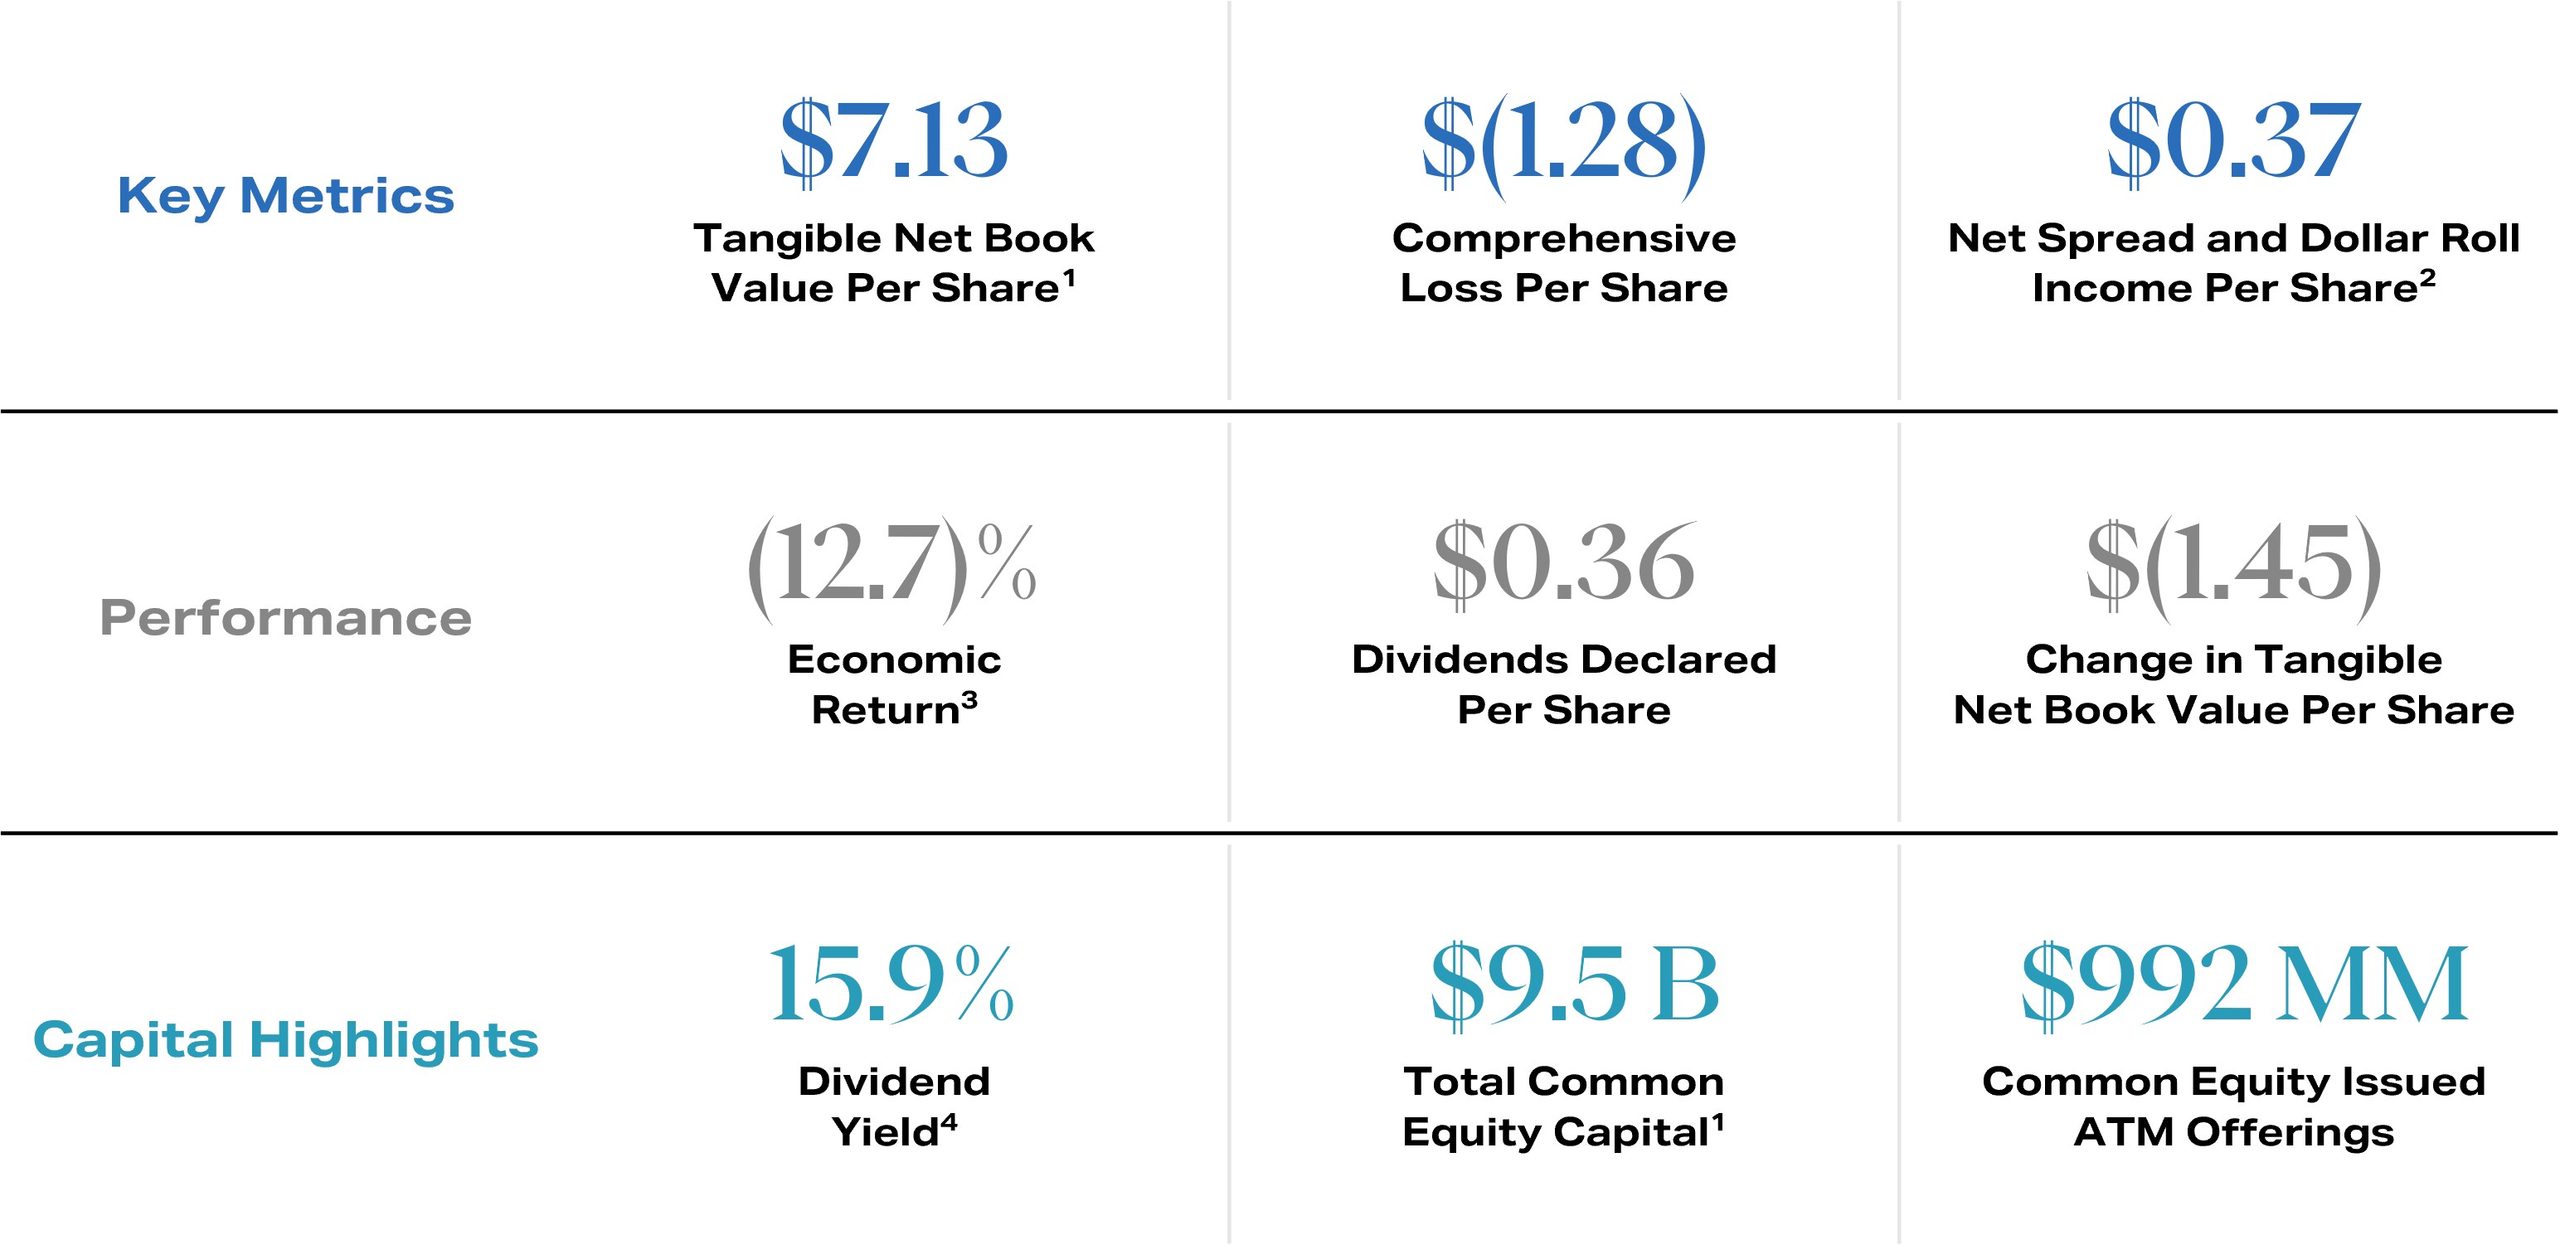
Fixed income markets experienced significant pressure in the third quarter, particularly in the final weeks of September, as fixed income investor sentiment turned decidedly bearish, interest rates increased sharply, and interest rate volatility spiked. The instability in the Treasury market drove pronounced weakness in the Agency MBS market, and, as a result, Agency MBS was the worst performing sector of the Bloomberg U.S. Aggregate Bond Index during the quarter. Consistent with this material underperformance of our underlying asset class, AGNC’s economic return on tangible common equity in the third quarter was (12.7)%.
Despite the challenging macroeconomic environment, there are a number of reasons for optimism with respect to the outlook for Agency MBS once volatility in the Treasury market subsides. First, the return profile of Agency MBS is more attractive at current valuation levels, as mortgage spreads to benchmark rates are approaching the upper end of their multi-year trading range. Second, the fundamentals for Agency MBS are more favorable today than they were at the start of the third quarter. At current rate levels, most of the duration extension for the mortgage universe has already occurred, while prepayment risk has declined as a result of the increase in rates and the resulting reduction in the share of mortgages with a meaningful incentive to refinance. Third, supply-demand technicals remain in balance as mortgage originations remain low at these elevated rate levels and demand has been resilient. Together, these factors support a constructive outlook for Agency MBS performance.
Q3 2026 Highlights
management commentary highlights
Macroeconomic and Agency MBS Market Environment
Peter Federico | President, Chief Executive Officer, and Chief Investment Officer
Fixed income markets experienced significant pressure in the third quarter, particularly in the final weeks of September, as a confluence of adverse conditions caused bond market sentiment to turn decidedly bearish, interest rates to move sharply higher, and interest rate volatility to spike. Periods of instability in the Treasury market often drive more pronounced weakness in the Agency MBS market. This was indeed the case in the third quarter, as Agency MBS was the worst-performing fixed income sector.
As a result of the underperformance of our asset class, AGNC’s economic return in the third quarter was (12.7)%. The challenging fixed income environment in the third quarter was driven by a number of negative catalysts, including substantial monetary policy uncertainty, mixed inflation data, the crowding out effect of historically high corporate debt issuance, heightened geopolitical risk, elevated energy prices associated with the Middle East conflict, and stronger-than-expected domestic economic growth. In a typical quarter, the impact of any one of these factors would have likely been considerable. Collectively, they led to historically poor quarterly fixed income and Agency MBS returns.
Monetary policy was perhaps the most significant negative catalyst. At the Jackson Hole Symposium in August, Chairman Warsh signaled a more restrictive monetary policy stance. Consistent with that message, the Fed raised the federal funds rate by 25 basis points at the September meeting, the first increase since 2023. Although the Chairman characterized the September rate hike as simply ‘removing a dose of accommodation,’ the market’s interpretation and subsequent repricing of monetary policy were much more dramatic. In late February, Fed funds futures reflected the expectation of three rate cuts by year-end, consistent with the Fed’s own projections and its gradual progression toward a neutral policy stance. Following the September rate hike, however, the market priced in four rate hikes by the middle of 2027. In total, the expected path of monetary policy increased by about 200 basis points over a very short time period. In effect, over a six month period, monetary policy expectations pivoted from a fixed income-friendly view that the Fed would provide additional accommodation by year-end to the belief that the Fed had embarked on a full tightening cycle. Against this backdrop, the yield on the 10-year Treasury increased 82 basis points over the course of the quarter, with 54 basis points of that move coming in September alone. A quarterly increase of that magnitude has occurred on just four other occasions over the last 30 years. This Treasury market weakness spread to other fixed income asset classes, as evidenced by the (3.5)% total return of the Bloomberg U.S. Aggregate Bond Index in the third quarter.
When Treasury yields rise sharply, as they did in the third quarter, it is not unusual for Agency MBS to experience greater weakness. This is evidenced in the performance of the Bloomberg Agency MBS Index, which posted a total return of (4.25)% in the third quarter. Moreover, on a duration-matched basis, Agency MBS underperformed U.S. Treasuries by nearly 120 basis points. Since 2010, the Agency MBS Index has underperformed Treasuries by a wider margin in only two other quarters. Those two periods were the third quarter of 2022, when the Fed raised short-term rates by 150 basis points and was rapidly reducing its balance sheet, and the third quarter of 2011, when the S&P 500 Index dropped (14)% and 10-year Treasury yields fell below 2%.
Despite this more challenging environment, there are a number of reasons to be optimistic about the outlook for Agency MBS. First, the return profile of Agency MBS is considerably more attractive at current valuation levels. At quarter end, the yield on a new production current coupon Agency MBS was close to 6.5%, which, for a security backed by the support of the U.S. Government, should be appealing to a wide range of investors. For hedged investors, the return opportunity is also compelling, with the spread between current coupon Agency MBS and benchmark rates ending the quarter near the upper end of a multi-year trading range at about 135 basis points to Treasuries and 165 basis points to swaps. Lastly, Agency MBS look increasingly attractive relative to investment grade corporate debt.
Second, mortgage cash flows have become more stable. When interest rates increase, the duration of Agency MBS also increases. This is the extension risk inherent in Agency MBS. At a certain rate level, however, mortgage durations plateau and become relatively insensitive to further rate increases. Given the magnitude of the rate move in the third quarter, that inflection point has largely been reached, meaning the vast majority of the duration extension in the mortgage universe has already occurred. Prepayment risk for Agency MBS has also diminished. A simple measure of prepayment risk is the percentage of outstanding Agency MBS that have a 50 basis point refinance incentive. With the primary mortgage rate meaningfully above the average note rate of the mortgage universe, less than 2% of the outstanding mortgage universe has a 50 basis point refinance incentive. Moreover, if mortgage rates were to drop by a full percentage point, the refinanceable population would increase to only 10% of the outstanding universe. In summary, the aggregate cash flows of the mortgage universe are more stable today because extension risk is minimal and prepayment options are further out of the money.
Finally, the technicals for Agency MBS continue to point to favorable performance once interest rate volatility subsides. With the primary mortgage rate near 7.5% and favorable year-end seasonality, the supply of new Agency MBS for the remainder of this year and into next year should be materially lower than previously anticipated. At the same time, the demand for Agency MBS should remain steady due to heavy bond fund inflows, the finalization of bank capital rules, the reemergence of the GSEs, and an uptick from other investors as they seek to take advantage of attractive return opportunities in the Agency MBS market. Taken together, these conditions should benefit Agency MBS performance over time. That said, interest rate volatility and macroeconomic uncertainty are likely to remain elevated over the near term, and Agency MBS performance will likely remain sensitive to that backdrop.
Our Quarterly Financial Results
Bernie Bell | EVP and Chief Financial Officer
For the third quarter of 2026, AGNC reported a comprehensive loss of $(1.28) per common share. Our economic return on tangible common equity was (12.7)% for the quarter, consisting of $0.36 of dividends declared per common share and a $(1.45) decline in tangible net book value per common share, due to the underperformance of our mortgage assets relative to our interest rate hedges. As of the close of business on Friday, October 16, 2026, our tangible net book value per common share was up approximately 3% since quarter end, or a little over 2% net of our October dividend accrual.
During the quarter, AGNC was added to the S&P MidCap 400 Index, an important milestone for the Company and a testament to the scale that AGNC has attained over our 18-year history. The announcement, and subsequent index rebalancing activity, drove significant trading volume in our common stock, and we took advantage of this outsized liquidity to issue $992 million of common stock through our at-the-market offering program at a significant premium to tangible net book value. Our access to capital at attractive levels enabled us to maintain our leverage profile within a reasonable band while growing our asset portfolio by $2.5 billion on a cost basis at wider spread levels. Even with this growth, leverage increased only modestly to 7.9x tangible equity at quarter end from 7.4x at the end of the second quarter. In addition, our liquidity position remained strong throughout the quarter, ending with $6.3 billion of unencumbered cash and Agency MBS, representing 57% of tangible equity.
Net spread and dollar roll income was $0.37 per common share for the quarter, down $(0.03) from the second quarter. The decrease primarily reflects two factors: a 14 basis point decline in our net interest spread, as higher funding costs more than offset higher asset yields, and a slight earnings drag from capital raised but not yet deployed. Lastly, the average projected life CPR of our portfolio declined nearly two percentage points to 6.7% at quarter end, consistent with higher rates. Actual CPRs for the quarter fell to 8.2% from 13.0% in the prior quarter.
Portfolio Update and Additional Commentary
Peter Federico | President, Chief Executive Officer, and Chief Investment Officer
The underperformance of Agency MBS was fairly uniform across the coupon stack in the third quarter. As measured by the Bloomberg Agency MBS Index, the negative excess return by coupon ranged from approximately 110 to 140 basis points. Middle coupons, which were widely held, marginally underperformed, as lower coupons benefited from a lack of supply and bond fund inflows, and higher coupons benefited from sharply reduced prepayment risk.
At quarter end, the market value of our asset portfolio totaled $94.4 billion. During the quarter, we purchased approximately $2 billion of primarily intermediate coupon specified pools. We also shifted the coupon composition of our portfolio somewhat higher given the more attractive yield profile of this segment of the market. As a result, the weighted average coupon on our portfolio increased to 5.13%. Through purchases and portfolio repositioning, the percentage of assets with favorable prepayment characteristics increased to 83%. A common misconception regarding specified pools is that these securities only provide a benefit in faster prepayment environments. Certain pools, however, can provide both call protection in declining rate scenarios and, importantly, extension protection in rising rate scenarios through seasoning and faster borrower turnover.
Our hedge portfolio, excluding receiver swaptions, totaled $85.7 billion at quarter end, an increase of more than $12 billion from the prior quarter, driven primarily by the addition of longer-term Treasury-based hedges. This hedge portfolio repositioning reflects our decision to offset nearly all of the asset duration extension that we experienced during the quarter as it occurred. Through these actions, our duration gap at quarter end was little changed at 0.8 years. Moreover, at current rate levels, the duration of our asset portfolio is close to fully extended and, as such, relatively insensitive to further rate increases.
Important Disclosures
This commentary includes excerpts from AGNC Investment Corp.’s (“AGNC”) Q3 2026 earnings call. Click here to listen to the full webcast and access the earnings release and presentation.
Per share amounts are per share of common stock, unless otherwise indicated. Income and loss per share amounts are per diluted common share, unless otherwise indicated.
1. As of September 30, 2026. Tangible Net Book Value Per Share and Total Common Equity Capital are net of the preferred stock liquidation preference. Tangible Net Book Value Per Share excludes goodwill.
2. Net Spread and Dollar Roll Income Per Share represents a non-GAAP measure. Refer to our Q3 2026 Stockholder Presentation for a reconciliation and further discussion of non-GAAP measures.
3. Economic Return represents the sum of the change in tangible net book value per common share and dividends declared on common stock during the period over the beginning tangible net book value per common share.
4. Dividend Yield as of September 30, 2026.
These materials contain forward-looking statements within the meaning of the Private Securities Litigation Reform Act. Forward-looking statements are based on estimates, projections, beliefs and assumptions of management of AGNC at the time of such statements and are not guarantees of future performance. Forward-looking statements involve risks and uncertainties in predicting future results and conditions. Actual results could differ materially from those projected in these forward-looking statements or from our historic performance due to a variety of important factors, including, without limitation, changes in monetary policy and other factors that affect interest rates, MBS spreads to benchmark interest rates, the forward yield curve, or prepayment rates; the availability and terms of financing; changes in the market value of AGNC’s assets; general economic or geopolitical conditions; liquidity and other conditions in the market for Agency securities and other financial markets; and legislative and regulatory changes that could adversely affect the business of AGNC. Certain factors that could cause actual results to differ materially from those contained in the forward-looking statements are included in AGNC’s periodic reports filed with the SEC and available on the SEC’s website at www.sec.gov. AGNC disclaims any obligation to update or revise any forward-looking statements based on the occurrence of future events, the receipt of new information, or otherwise.
We use our website (www.AGNC.com) and AGNC’s LinkedIn and X accounts to distribute information about the Company. Investors should monitor these channels in addition to our press releases, SEC filings, and public conference calls and webcasts, as information posted through them may be deemed material. Stockholders and other interested parties may sign up to receive AGNC’s news, perspectives, and other types of email alerts by clicking the Subscribe link.