
THE EARNINGS Extract
Q4 and full year 2025 EARNINGS COMMENTARy
JANUARY 27, 2026
The fourth quarter of 2025 capped an exceptional year for AGNC shareholders. For the year, AGNC generated an impressive economic return on tangible common equity of 22.7%. Even more noteworthy, AGNC’s total stock return in 2025 was 34.8% with dividends reinvested, nearly double the performance of the S&P 500 Index. This performance, on both a relative and absolute basis, demonstrates the value of AGNC’s actively managed portfolio of Agency MBS and associated hedges.
Agency MBS was the best performing domestic fixed income asset class in the fourth quarter and produced a total return for the year of 8.6%, the best full-year return for Agency MBS since 2002. This strong performance was driven by a confluence of several factors. The Federal Reserve shifted monetary policy toward lower short-term rates and greater accommodation, and interest rate volatility declined. In addition, uncertainty and potential risks associated with GSE reform were reduced as Administration officials communicated a framework focused on maintaining mortgage market stability and improving housing affordability. Collectively, these and other factors led to substantial outperformance of Agency MBS relative to other fixed income asset classes, reduced Agency MBS spread volatility, and caused mortgage spreads to benchmark rates to tighten over the course of the year.
As we begin 2026, the macroeconomic themes of lower interest rate and Agency MBS spread volatility remain in place and provide a constructive investment backdrop for our business. Other positive developments, such as recent Agency MBS purchases by Fannie Mae and Freddie Mac and other market initiatives contemplated by the Administration and the Federal Reserve, could be a catalyst for further mortgage spread tightening. These dynamics, coupled with a balanced supply-demand outlook, are supportive of our optimistic perspective on Agency MBS. Moreover, we believe that AGNC, as the largest pure-play Agency MBS mortgage REIT, is very well positioned in this environment to continue to generate favorable risk-adjusted returns with a substantial yield component for our shareholders.
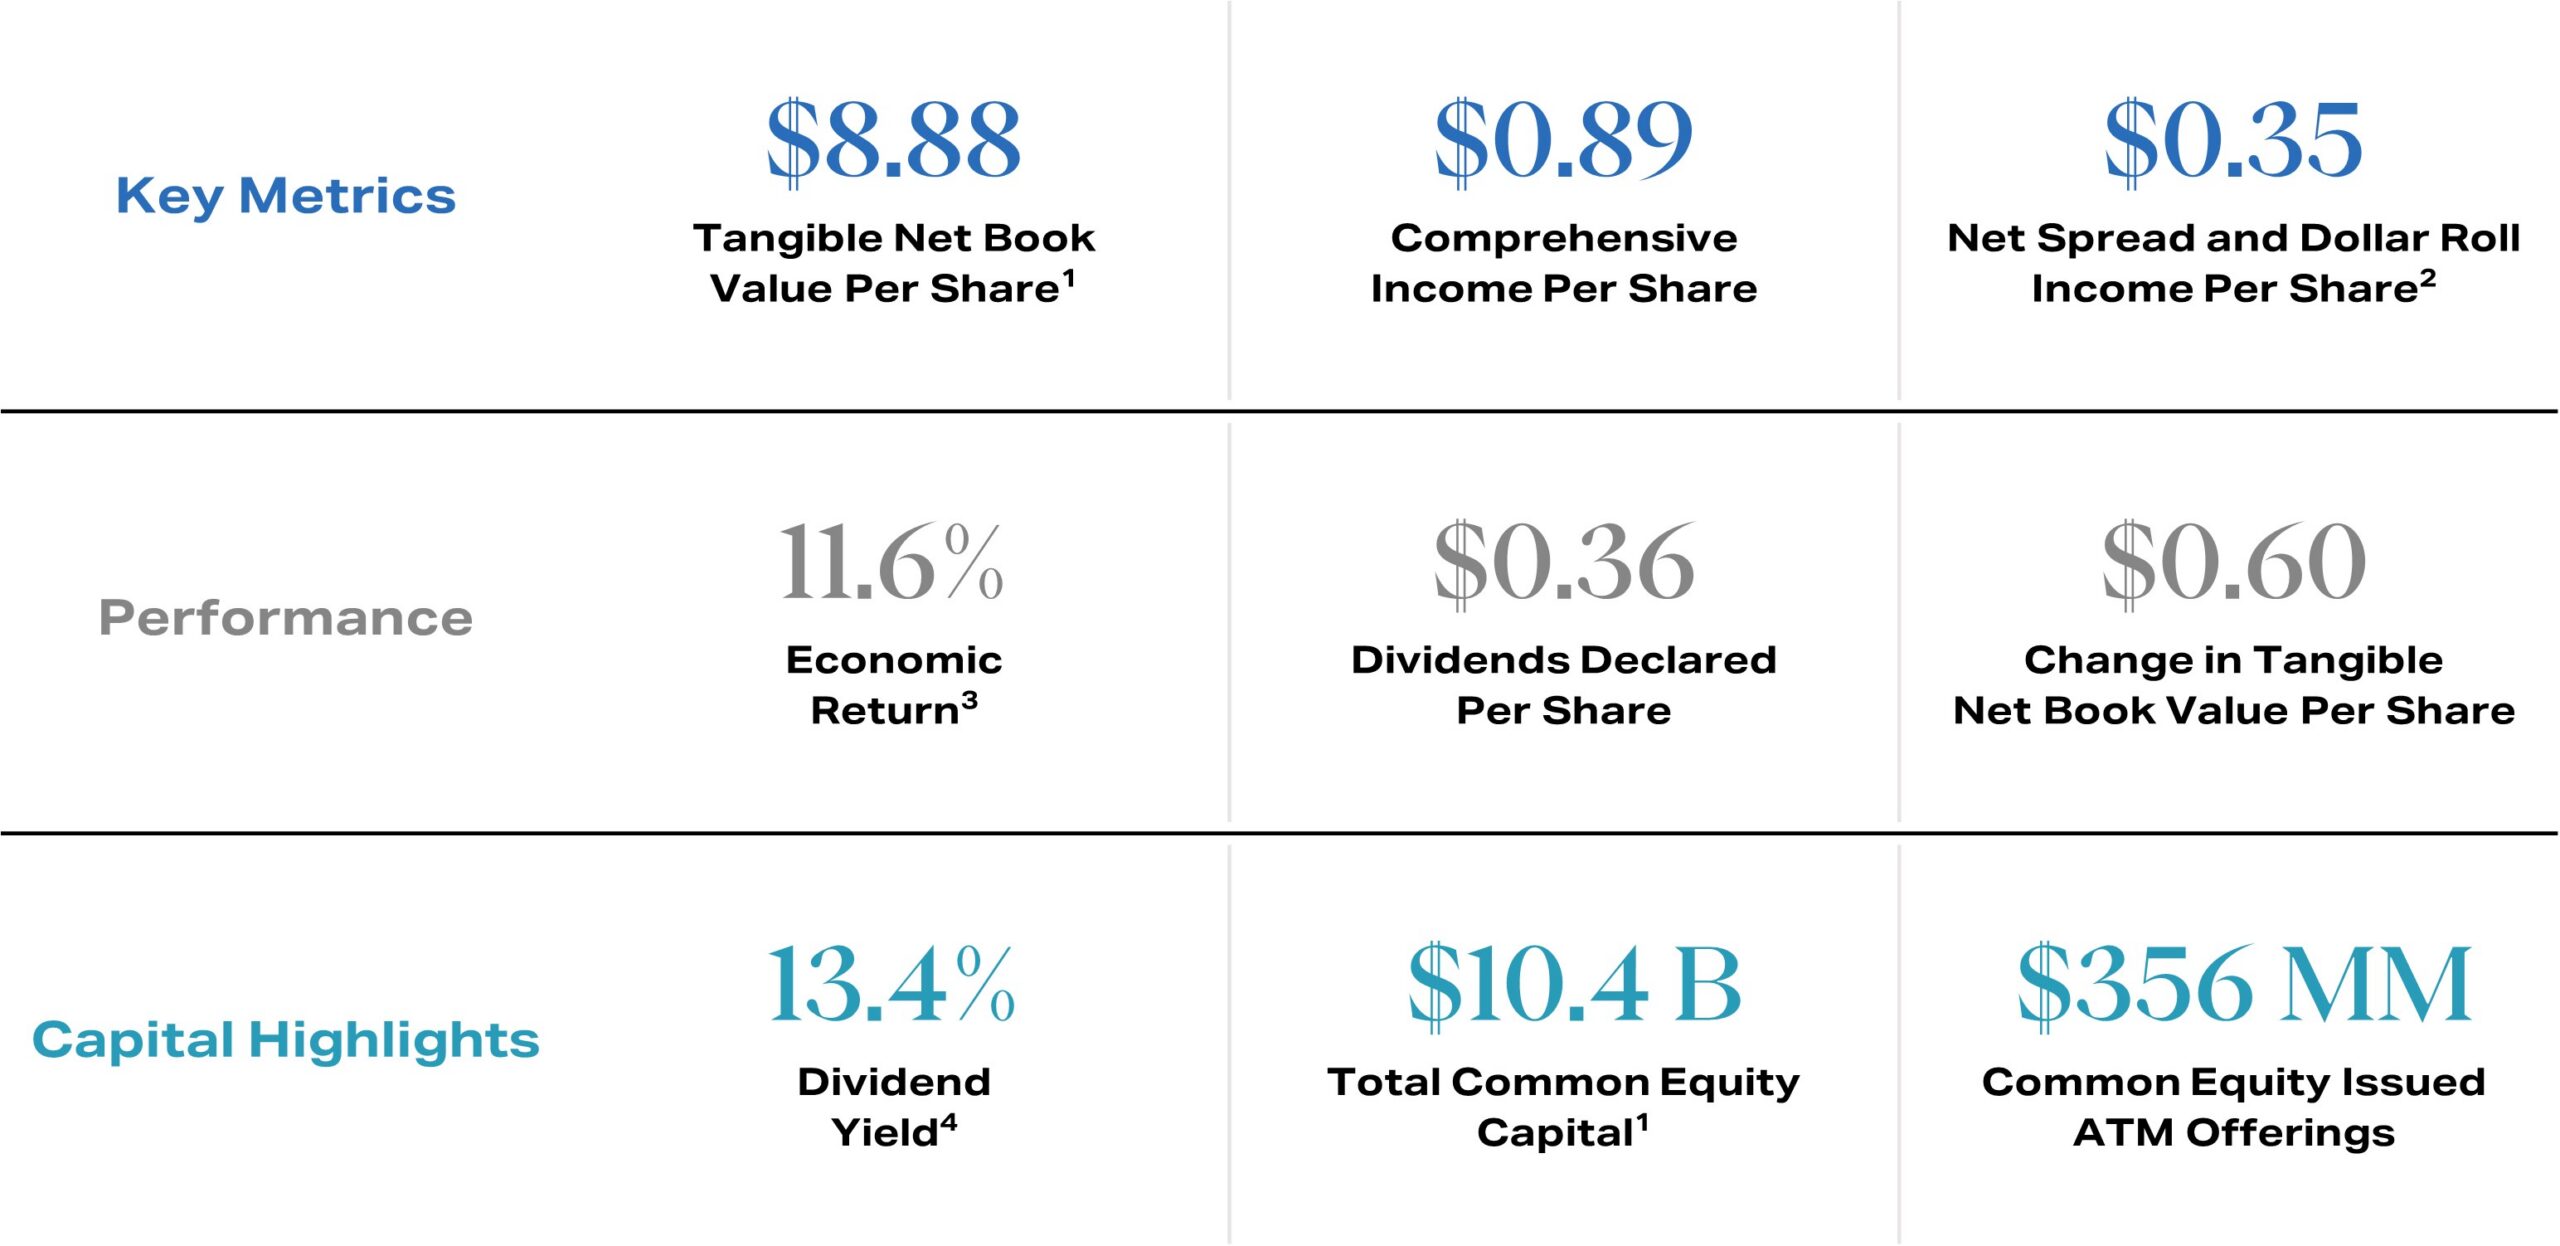
Q4 2025 Highlights
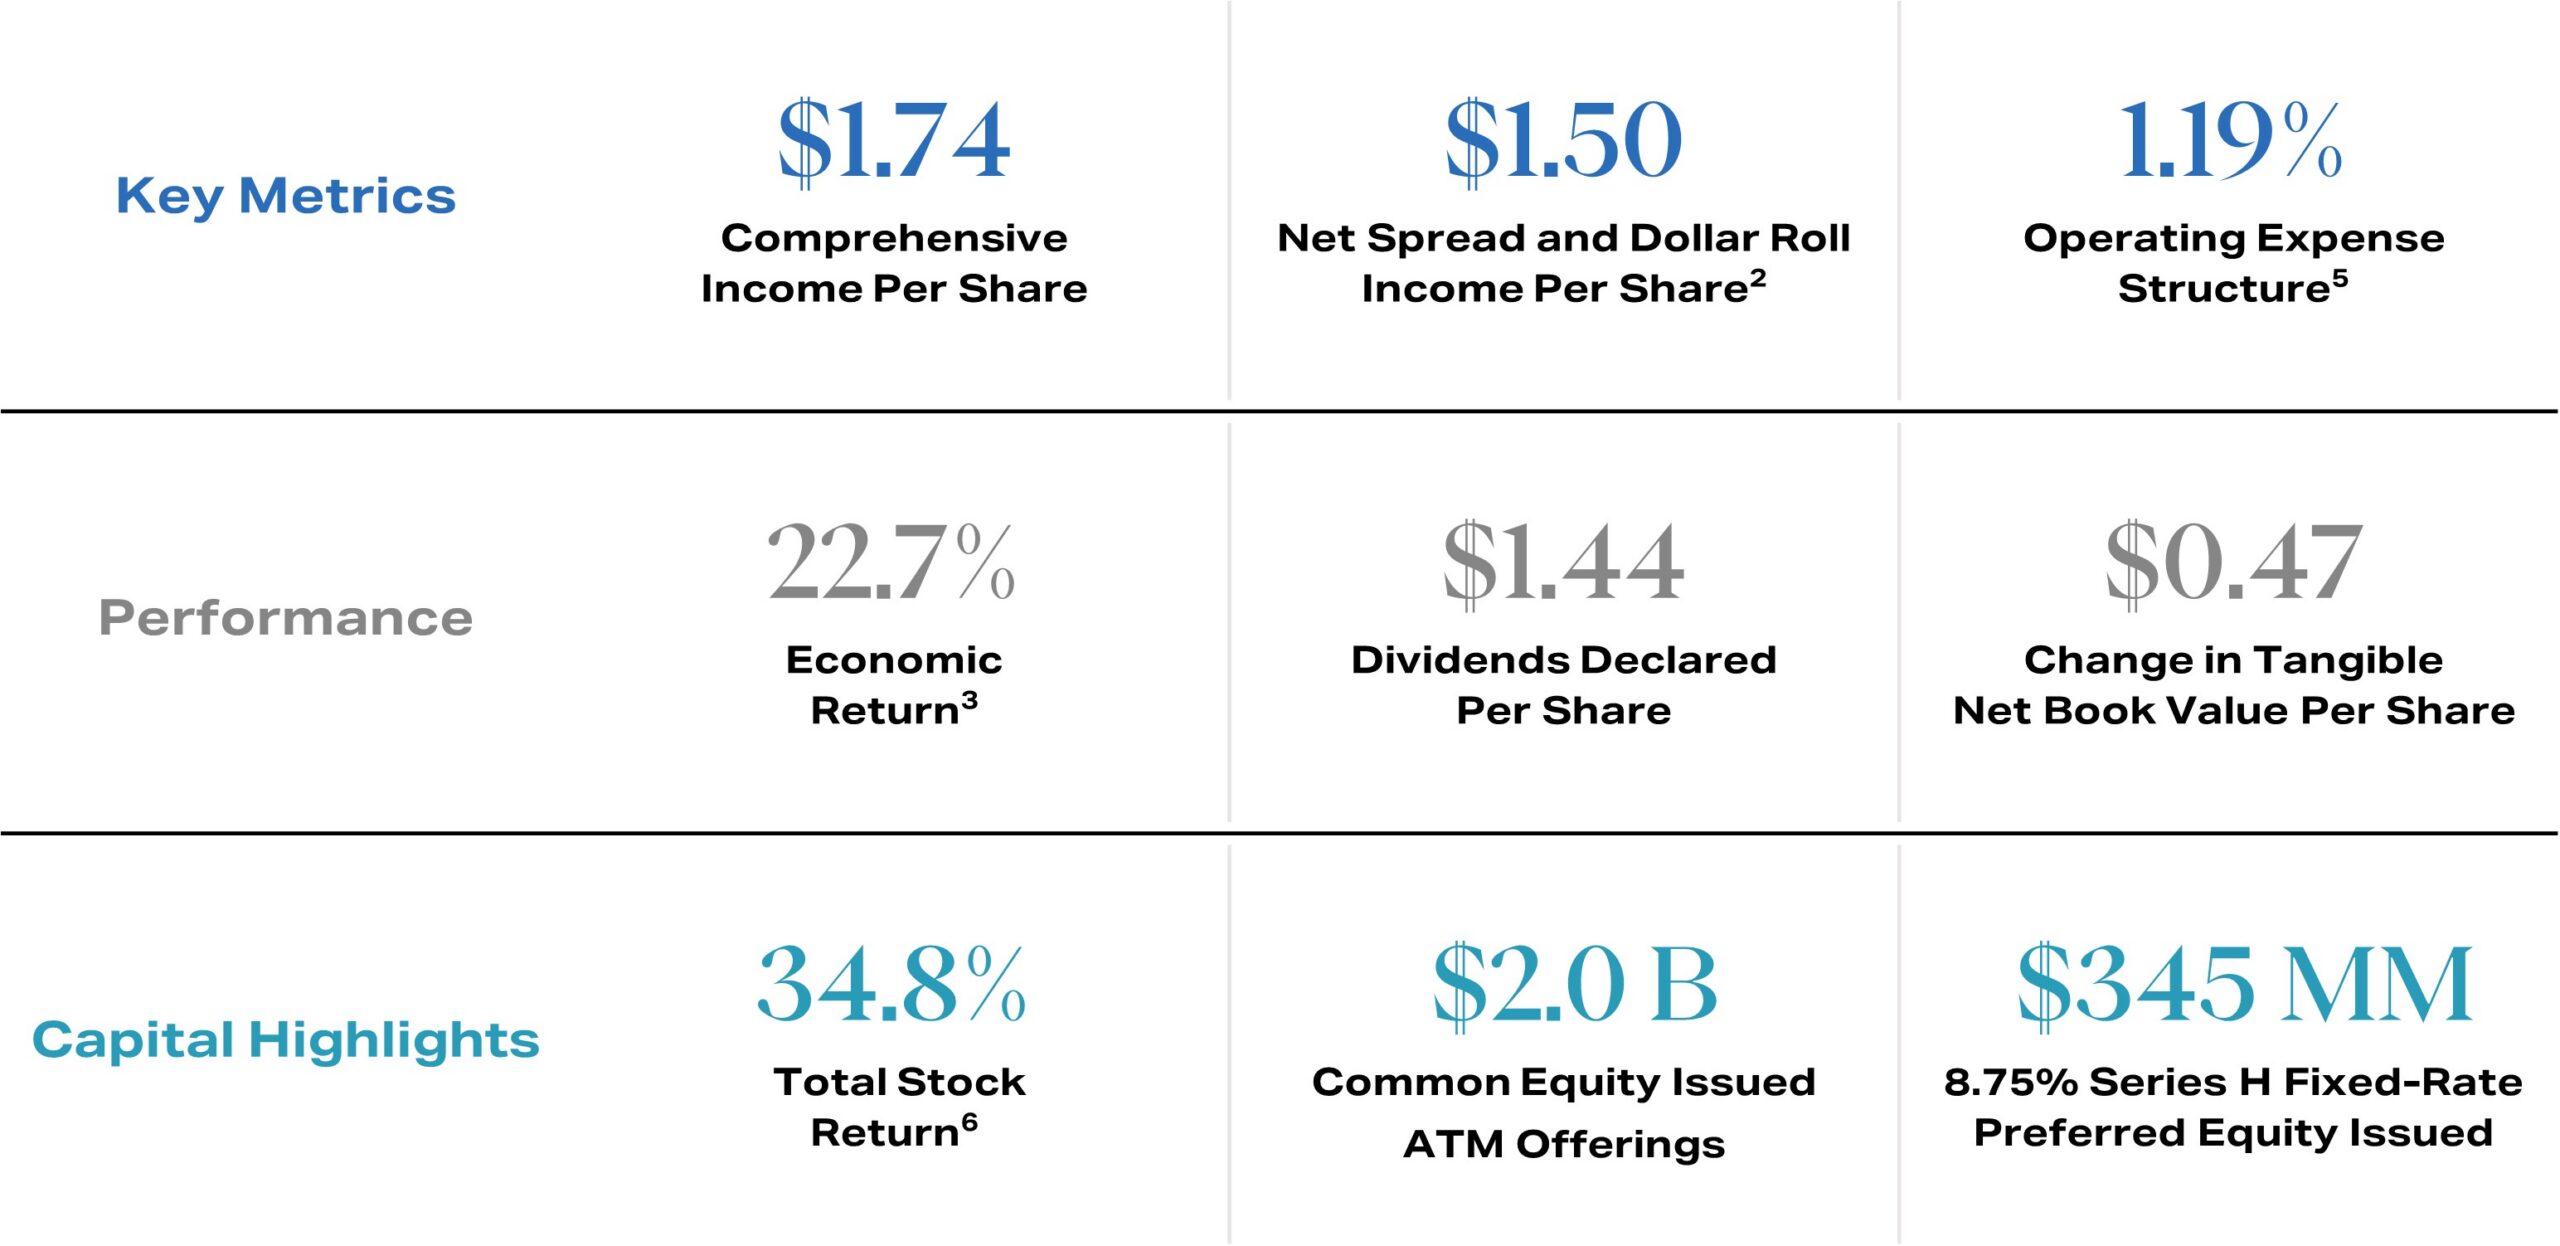
full year 2025 Highlights
management commentary highlights
Macroeconomic and Agency MBS Market Environment
Peter Federico | President, Chief Executive Officer, and Chief Investment Officer
2025 was an exceptional year for AGNC shareholders. AGNC’s 11.6% economic return in the fourth quarter drove our impressive full year economic return of 22.7%. Even more noteworthy, AGNC’s total stock return in 2025 was 34.8% with dividends reinvested, nearly double the performance of the S&P 500 Index. This outstanding performance on an absolute and relative basis clearly demonstrates the value of AGNC’s actively managed portfolio of Agency MBS and associated hedges.
Looking back, we were confident that AGNC was on the forefront of a uniquely positive investment environment as the Fed’s unprecedented tightening cycle of 2022 and 2023 reached its conclusion. On our Q3 2023 earnings call, we expressed our belief that a durable and attractive investment environment for AGNC was emerging as mortgage spreads began to stabilize at historically attractive return levels. That outlook proved to be correct, and in the nine quarters since the Q3 2023 earnings call, and despite several episodes of extreme market turbulence, AGNC has generated an economic return of 50% for its shareholders, comprised of a 10% increase in tangible net book value and monthly dividends totaling $3.24 per common share. Moreover, during that same time period, AGNC shareholders have experienced a total stock return of nearly 60%, or 23% on an annualized basis. And finally, since inception, AGNC has generated a total stock return of over 11% on an annualized basis with dividends reinvested, demonstrating the long-term benefit of investing in this unique fixed income asset class and the durability of our business model across a wide range of market environments.
Turning back to 2025, the Bloomberg Aggregate Agency MBS Index was the best-performing fixed income sector in the fourth quarter, and for the year, produced a total return of 8.6%. Also noteworthy given the similar credit quality, the Agency MBS Index outperformed the Treasury Index by 2.3 percentage points, or 36%, in 2025. The favorable performance of Agency MBS was driven by a confluence of positive factors. First, the Fed shifted its monetary policy stance toward lower short-term rates and greater accommodation, a promising development for all fixed income assets. The Fed also transitioned its balance sheet activity from quantitative tightening to reserve management. Second, interest rate volatility trended lower throughout the year due to the shift in monetary policy, greater fiscal policy clarity, and a stable supply outlook for Treasury securities, which included a greater share of short-term debt. Lastly, the uncertainty and potential risks associated with GSE reform that adversely impacted the Agency MBS market early in the year gradually dissipated as the Treasury Department and other officials communicated an approach to GSE reform that focused on reducing the spread on Agency MBS, maintaining mortgage market stability, and improving housing affordability. Collectively, these factors, combined with the sizable purchase of Agency MBS by the GSEs later in the year, caused spreads to tighten and drove the substantial outperformance of Agency MBS relative to other fixed income asset classes.
As we begin 2026, these favorable macro themes remain in place and provide a constructive investment backdrop for our business. In addition, other positive developments are possible, including further actions by the Administration to improve housing affordability. The recent $200 billion Agency MBS purchase announcement is a good example of the type of action that could result in tighter mortgage spreads and lower mortgage rates. The funding market for Agency MBS has also improved in response to the Fed increasing the size of its balance sheet and improving the functionality of its Standing Repo Program. The Fed is also considering other actions to further improve the utility of the Standing Repo Program, which, if implemented, would be highly beneficial to the Agency MBS market. Finally, the supply and demand outlook for Agency MBS remains well balanced. At current rate levels, the net new supply of Agency MBS in 2026 is expected to be about $200 billion. When combined with the Fed’s runoff, the private sector will have to absorb about $400 billion of Agency MBS in 2026, an amount similar to the previous two years. On the demand side of the equation, however, the investor base today is more diversified and positioned to expand, with GSE purchases potentially consuming about half of this year’s supply. At the same time, bank, money manager, foreign investor, and REIT demand should all remain strong.
Pulling this all together, the underlying fundamental and technical backdrop for Agency MBS continues to be favorable and supportive of our positive outlook. Moreover, as the largest pure-play Agency mortgage REIT, we believe AGNC is very well positioned to generate compelling risk-adjusted returns with a substantial yield component for our shareholders.
Our Quarterly Financial Results
Bernie Bell | EVP and Chief Financial Officer
For the fourth quarter, AGNC reported comprehensive income of $0.89 per common share. Our economic return on tangible common equity was 11.6% for the quarter, consisting of $0.36 of dividends declared per common share and a $0.60 increase in tangible net book value per share, driven by lower interest rate volatility and tighter mortgage spreads to benchmark interest rates. Our full year economic return was 22.7%, reflecting our monthly dividend totaling $1.44 per common share and a $0.47 increase in tangible net book value per share. As of late last week, our tangible net book value per common share was up about 4% for January, or about 3% net of our monthly dividend accrual.
We ended the fourth quarter with leverage of 7.2x tangible equity, down from 7.6x at the end of the third quarter. Average leverage for the fourth quarter was 7.4x, compared to 7.5x in the third quarter. In addition, we concluded the quarter with a very strong liquidity position of $7.6 billion in cash and unencumbered Agency MBS, representing 64% of tangible equity.
Net spread and dollar roll income was unchanged for the quarter at $0.35 per common share, which includes $0.01 per share of expense related to year-end incentive compensation accrual adjustments. An important driver of our net spread and dollar roll income is the level of unhedged short-term debt in our funding mix as well as the composition of our hedge portfolio. As of the end of the fourth quarter, our hedge ratio was 77%, reflecting the level of swap and Treasury hedges relative to total funding liabilities and was unchanged from the prior quarter. At the same time, during the fourth quarter, we opportunistically shifted our hedge mix toward a greater proportion of interest rate swaps. As a result, a meaningful portion of our funding remains short-term and variable rate. This is consistent with the current more accommodative monetary policy environment and positions net spread and dollar roll income to benefit as additional rate cuts occur. Looking ahead, we expect that (i) lower funding costs from the October and December rate cuts and anticipated future rate cuts, (ii) increased stability in funding markets resulting from recent Fed actions to maintain short-term rates within their target range, and (iii) the shift in our hedge mix toward a greater share of swap-based hedges, will collectively provide a moderate tailwind to net spread and dollar roll income.
The average projected life CPR of our portfolio increased 100 basis points to 9.6% at quarter-end from 8.6% in the prior quarter due to lower mortgage rates. Actual CPRs averaged 9.7% for the quarter, compared to 8.3% in the prior quarter.
Lastly, during the fourth quarter, we issued $356 million of common equity through our at-the-market offering program at a significant premium to tangible net book value per share. This brought total accretive common equity issuances for the year to approximately $2 billion and delivered exceptional book value accretion for our common shareholders.
Portfolio Update and Additional Commentary
Peter Federico | President, Chief Executive Officer, and Chief Investment Officer
Agency MBS spreads to both Treasury and swap rates tightened across the coupon stack, especially on intermediate coupons, as interest rate and spread volatility remained low and the demand for Agency MBS, particularly from the GSEs, accelerated.
Hedge composition was also an important driver of performance, as swap spreads on 5- and 10-year swaps widened significantly during the quarter. This favorable move in swap spreads followed the announcement of the Fed’s revised supplemental leverage ratio requirement and the Fed’s actions to ease repo funding pressure. As a result, Agency MBS hedged with longer-dated swap-based hedges performed considerably better than positions hedged with Treasury-based hedges.
Our asset portfolio totaled $95 billion at quarter-end, up about $4 billion from the prior quarter, as we fully deployed our new capital that we raised during the quarter. The percentage of our assets with some form of favorable prepayment attribute remained steady at 76%, while the weighted average coupon on our portfolio fell slightly to 5.12%.
Consistent with the growth in our asset portfolio, the notional balance of our hedge portfolio increased to $59 billion at quarter-end. The composition of our portfolio also shifted toward a greater share of swap-based hedges. In duration dollar terms, our allocation to swap-based hedges increased to 70% of our portfolio, from 59% the prior quarter. In light of our more favorable outlook for swap spreads, we will likely operate with a greater share of swap-based hedges in our hedge mix, particularly once short-term rates near the Fed’s long-run neutral rate.
Important Disclosures
This commentary includes excerpts from AGNC Investment Corp.’s (“AGNC”) Q4 2025 earnings call. Click here to listen to the full webcast and access the earnings release and presentation.
Per share amounts are per share of common stock, unless otherwise indicated. Income and loss per share amounts are per diluted common share, unless otherwise indicated.
1. As of December 31, 2025. Tangible Net Book Value Per Share and Total Common Equity Capital are net of the preferred stock liquidation preference. Tangible Net Book Value Per Share excludes goodwill.
2. Net Spread and Dollar Roll Income Per Share (f/k/a Net Spread and Dollar Roll Income, Excluding “Catch-Up” Amortization, Per Share) represents a non-GAAP measure. Refer to our Q4 2025 Stockholder Presentation for a reconciliation and further discussion of non-GAAP measures.
3. Economic Return represents the sum of the change in tangible net book value per common share and dividends declared on common stock during the period over the beginning tangible net book value per common share.
4. Dividend Yield as of December 31, 2025.
5. Operating Expense Structure calculated as total operating expense divided by average stockholders’ equity for the period. Average stockholders’ equity calculated as the average month-ended stockholders’ equity during the period.
6. Total Stock Return includes common stock price appreciation and dividend reinvestment. Dividends assumed to be reinvested at the closing price on the ex-dividend date. Source: Bloomberg.
These materials contain forward-looking statements within the meaning of the Private Securities Litigation Reform Act. Forward-looking statements are based on estimates, projections, beliefs and assumptions of management of AGNC at the time of such statements and are not guarantees of future performance. Forward-looking statements involve risks and uncertainties in predicting future results and conditions. Actual results could differ materially from those projected in these forward-looking statements or from our historic performance due to a variety of important factors, including, without limitation, changes in monetary policy and other factors that affect interest rates, MBS spreads to benchmark interest rates, the forward yield curve, or prepayment rates; the availability and terms of financing; changes in the market value of AGNC’s assets; general economic or geopolitical conditions; liquidity and other conditions in the market for Agency securities and other financial markets; and legislative and regulatory changes that could adversely affect the business of AGNC. Certain factors that could cause actual results to differ materially from those contained in the forward-looking statements are included in AGNC’s periodic reports filed with the SEC and available on the SEC’s website at www.sec.gov. AGNC disclaims any obligation to update or revise any forward-looking statements based on the occurrence of future events, the receipt of new information, or otherwise.
We use our website (www.AGNC.com) and AGNC’s LinkedIn and X accounts to distribute information about the Company. Investors should monitor these channels in addition to our press releases, SEC filings, and public conference calls and webcasts, as information posted through them may be deemed material. Stockholders and other interested parties may sign up to receive AGNC’s news, perspectives, and other types of email alerts by clicking the Subscribe link below.